QuestionPro XA: Analysis and Experience Dashboard

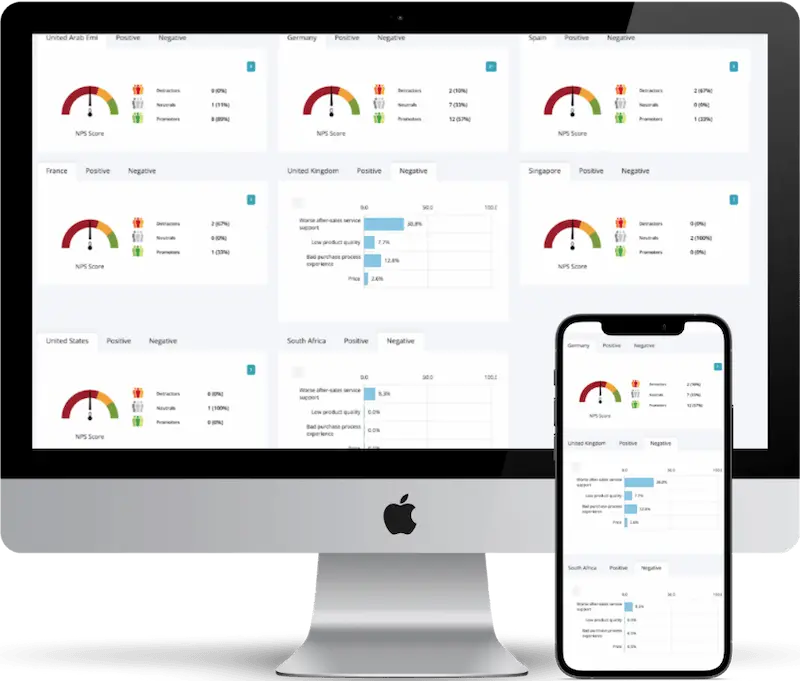
Quote analysis dashboardQuestionPro XA enables comprehensive and clear analysis of experience data and operational data in real time. Including AI-based sentiment analysis. The rights model allows intelligent user management.

Analytics dashboard

Gain an advanced view of survey data and touchpoint analytics with the QuestionPro XA analytics and experience dashboard. Share analytics across the organisation by individual rights and roles.

Analysis Experience Dashboard QuestionPro XA

The right data at the right time for the right person: The real-time analysis dashboard QuestionPro XA.

QuestionPro's analytics and experience dashboard is a widget-based and fully customisable graphical analytics platform. QuestionPro XA includes extensive graphical analysis capabilities and also enables collaborative work via the internal messaging and notification system. QuestionPro XA has a sophisticated rights and role model for hierarchical access to data and content. Multi-dimensional organisational structures, e.g. subdivided into companies, business units, regions or departments, can also be mapped.

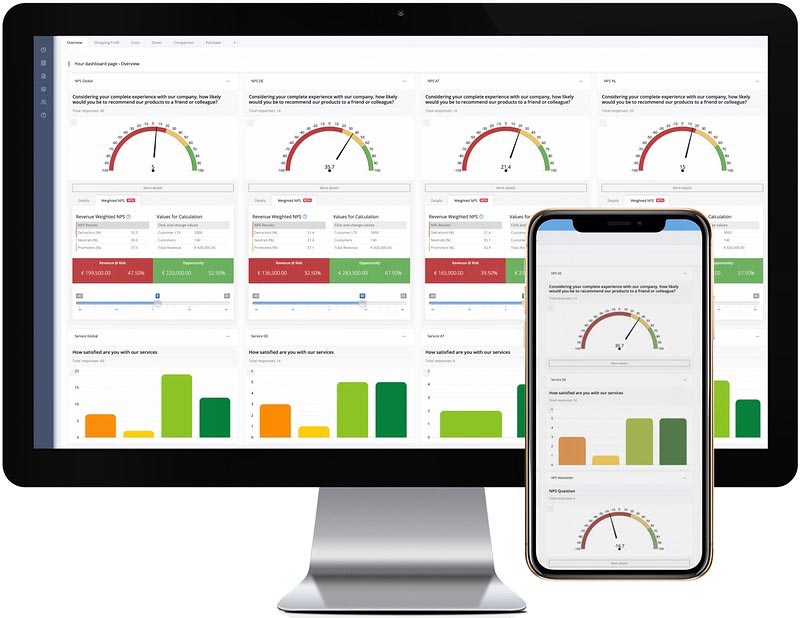
The Experience Dashboard from QuestionPro for visualizing data from surveys and touchpoint analyses

At a glance: The most important features & functions of QuestionPro XA

With QuestionPro's analysis and experience dashboard, you will analyse data from surveys and touchpoint analyses quickly, clearly and intuitively via an easy-to-use user interface.

Fast setup

QuestionPro's analysis and experience dashboard is quick and easy to set up. Users can be added via batch upload. The look & feel can be customised to match your company's CI. Include your logo and your own start image.

Rights, roles, segments

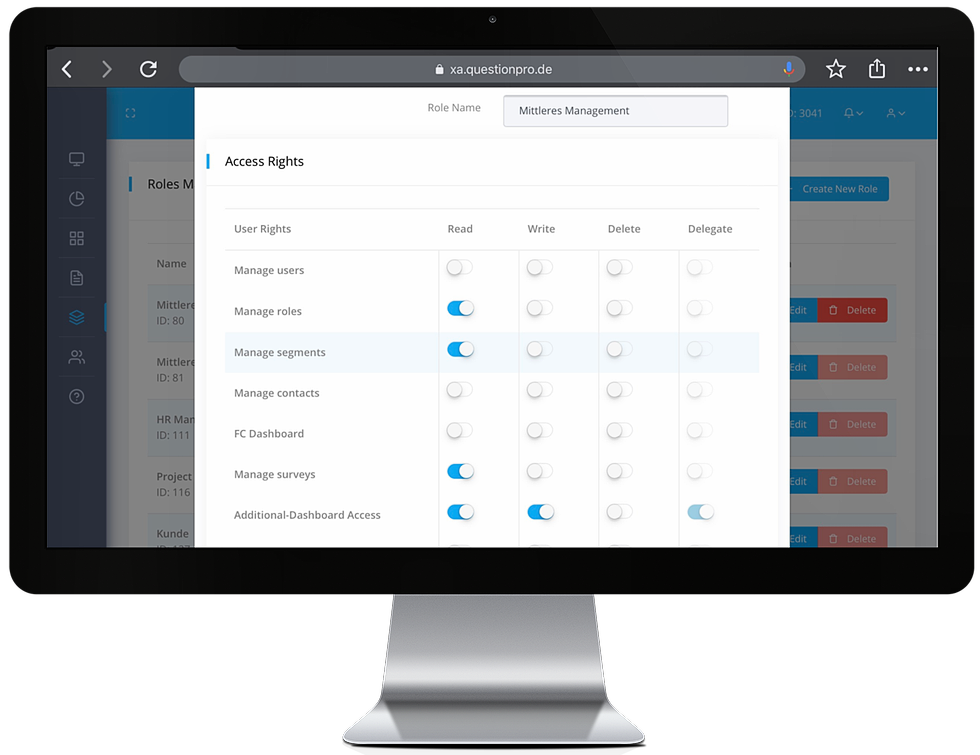
You decide who can manage, read, edit, delete and delegate which content! Set individual rights and roles for each user. Define segments for your evaluation, such as teams, regions, departments, business units etc.

Multi-dashboards

Specify individually which content you would like to see directly after logging in. Easily configure analytics and reporting dashboard to your liking. Set up multiple dashboards for different views and evaluations.

Data visualization

Your evaluations are presented in a graphically appealing and clear manner in the form of customisable charts and graphs. Automatically create individual reports in PDF format and export your data to CSV and XLS formats if required.

collaboration

The integrated messaging and notification system enables quick and easy sharing of survey results and evaluations with other users, user groups and segments.

Analyses

Internal and external benchmarking, time series comparisons, heatmaps, score cards, key driver analyses, definition of KPIs, semantic text analysis, touchpoint analyses, determination of response rates and participant statistics, survey management, translation module, etc.

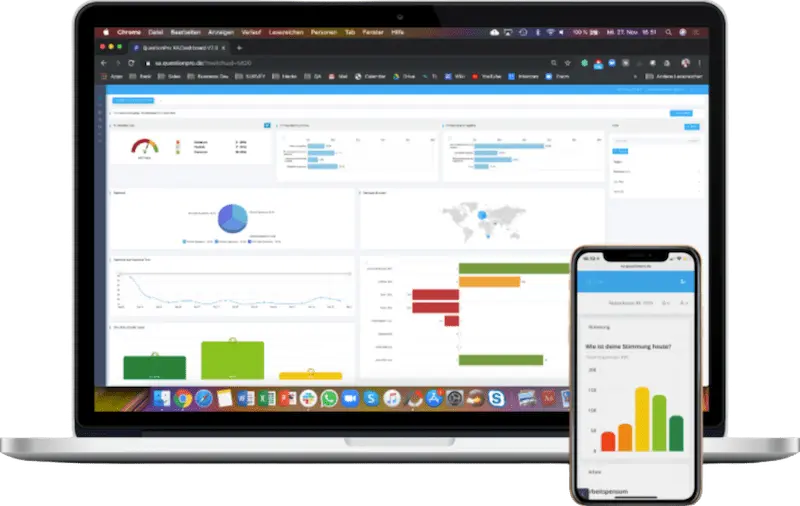
Experience Dashboard with NPS and CSAT

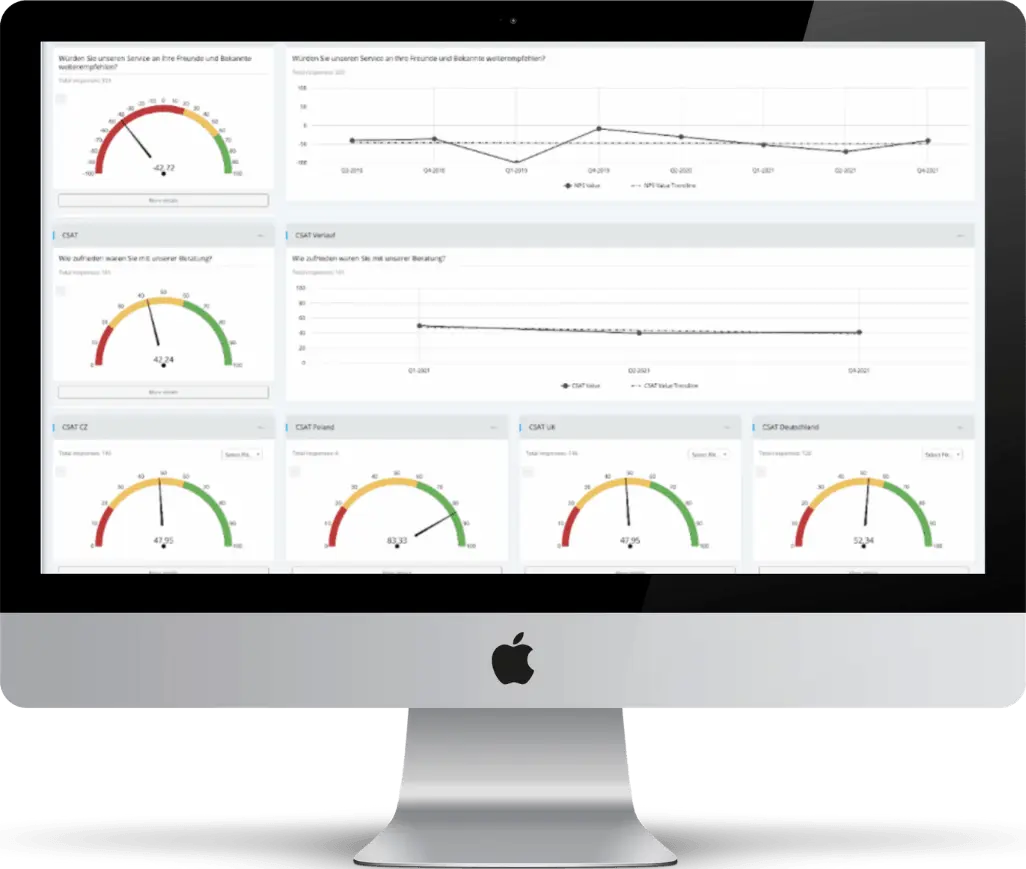
Example view: Individually configured experience dashboard with Net Promoter Score (NPS meter) and CSAT elements, as well as time histories. Everything at a glance.

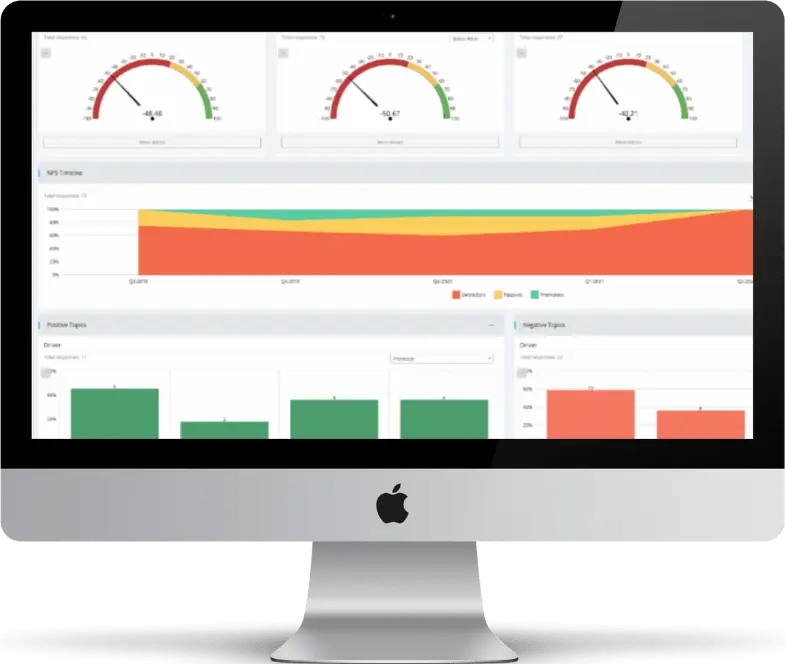
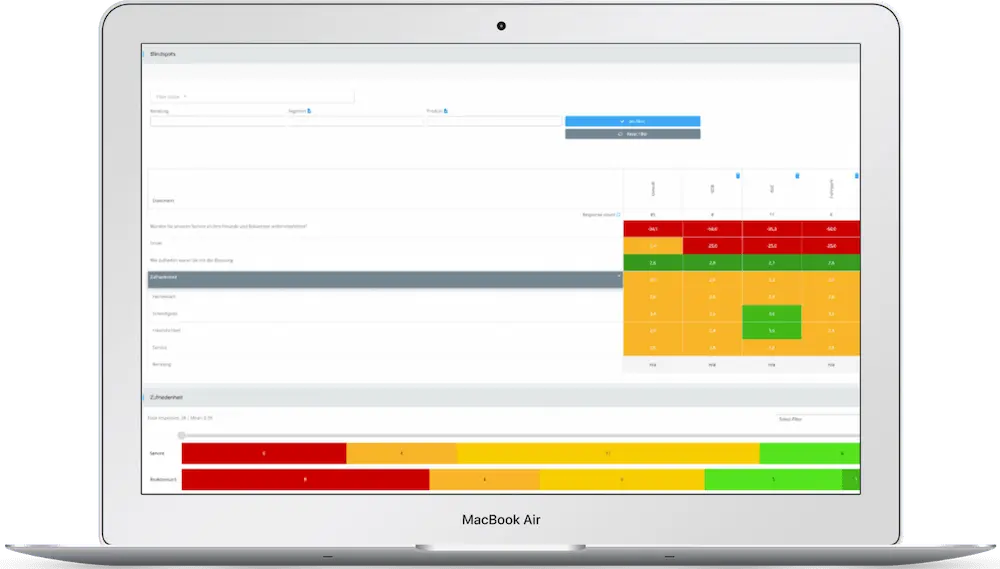
Analysis dashboard with heat map and NPS

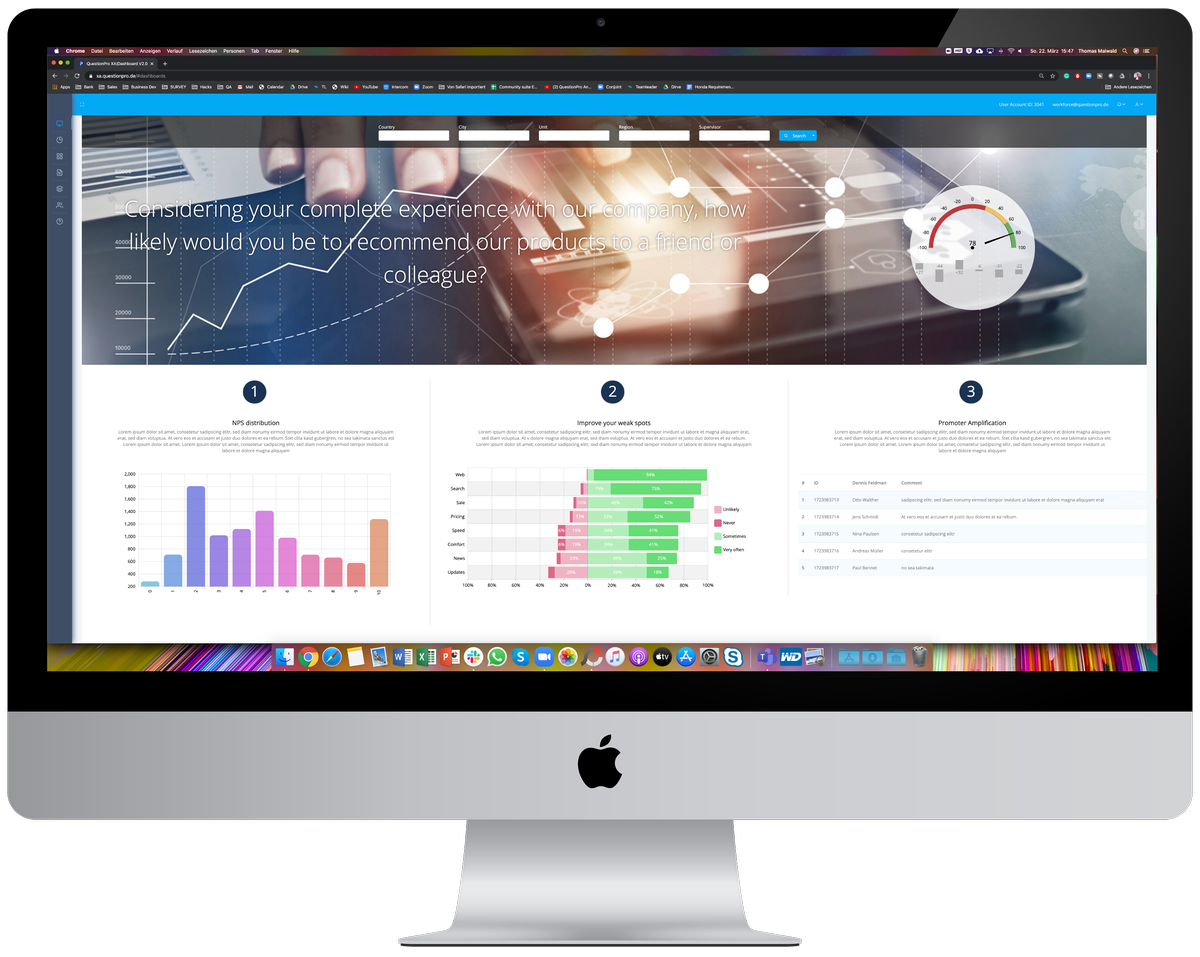
Example view: The QuestionPro experience dashboard can be put together individually according to your wishes and requirements.

LIVE DEMO

Analysis and Experience Dashboard QuestionPro XA: Acquire, connect, consolidate, analyse and visualize data. Intuitive. Fast. Simply. Real time!

Analysis dashboard for market research and experience management - 1:1 live online presentation

Create custom dashboards quickly and easily with intuitive widget wizard

With the support of an intuitive widget wizard within QuestionPro XA's analysis and experience dashboard, you can create multiple, individual and clear dashboards for different result views and graphical analyses. The wizard is of course "mobile ready", so you can easily configure and customise your dashboards using mobile devices.

There are no limitations on the number of individual dashboards and on their contents. Individual widgets can be conveniently dragged and dropped, so you can arrange their positions flexibly.

Widget-based analysis and experience dashboard

Share your dashboard views and ratings with other analytics and experience dashboard users

Share your dashboard views and ratings with other analytics and experience dashboard users

The Analysis and Experience Dashboard for evaluating and visualising data and tests in the context of market research and experience management is a multi-user application that allows you to share views and evaluation results with other users, user groups and segments.

QuestionPro XA enables you to work collaboratively in teams. If you share your dashboards, the relevant recipients will receive a message via the internal notification system.

Simple user management: employees import, assignment of roles and rights

The QuestionPro XA web-based analysis and experience dashboard offers easy user import via batch upload. After import, each individual user can be assigned different rights and roles, such as read, write, delete and delegation rights.

  • Reading rights: Who is allowed to see which content
  • Writing rights: Who is allowed to edit which content
  • Deletion rights: Who may delete which contents
  • Delegation rights: Who can delegate tasks to others

Simple user management: employees import, assignment of roles and rights

Evaluate and visualize survey data and touchpoint analyses with the QuestionPro XA analysis dashboard

Segment management and benchmarking

You can quickly and easily create different segments for your evaluations, such as business areas, departments, regions or teams. As at the user management level, different rights and roles can also be assigned to the segments. With the QuestionPro XA analysis and experience dashboard, you are thus able to map a multi-dimensional organisational structure.

The segment management allows you to benchmark internally so that you can compare individual segments with each other. Of course, QuestionPro XA also offers the possibility to integrate an external benchmark.

Graphical analysis

QuestionPro XA provides you with extensive and individually customisable evaluation and reporting functions. The dashboard principle allows you to see the most important evaluations at a glance directly after logging in, according to your personal configuration. All graphical evaluation options are available to you - such as bar charts, pie charts, line charts or bar graphs.

Reporting & Data export

Easily export your individually configured reports as a PDF document with just a click of the mouse. You can adapt the templates to the specific layout of your company. The web-based analysis and experience dashboard QuestionPro XA also offers you the option of exporting data into CSV and XLS formats.

The web-based analysis and experience dashboard QuestionPro XA also offers you the option of exporting data into CSV and XLS formats

Easily create sophisticated landing pages and web presentation for your surveys and analysis results

Easily create sophisticated landing pages and web presentation for your surveys and analysis results

With QuestionPro's analysis and experience dashboard, you can create and easily design sophisticated landing pages or even complex web portals for conducting online surveys and presenting survey and analysis results. You can also define access rights to specific web pages via the web backend. For example, it is possible to make certain content accessible only to a selected target group. The frontend can be fully adapted to the CI of your organisation.

Features & Benefits

Evaluate market research studies, touchpoint analyses and data from distributed third-party systems easily, quickly, clearly and cost-effectively.

  • Web-based portal solution. No installation or maintenance necessary
  • The analysis and experience dashboard can be individually adapted to your own CI
  • Simple coupling between the analysis & experience dashboard and the main survey account via API interface
  • Batch upload of users and simple rights assignment via toggle switch
  • Mapping a multidimensional organizational structure
  • Easy to set up freely configurable dashboards using the widget wizard
  • Sharing dashboards, survey results and selective evaluations
  • Data visualization simply via drag & drop
  • Integrated notifiction system for collaborative work
  • Comprehensive graphical analysis and integrated custom reporting
  • Semantic text analyses
  • Internal and external benchmarking
  • Time series comparisons
  • Report download via PDF
  • Data export to CSV and XLS
  • Integrated translation module for free text comments
  • Mobile ready
  • Depositing KPIs possible
Platform for market research and experience management
/* LinkedIn Insight Tag*/