Market research & experience management
The amount of data available to companies is immense: a lot of data is collected in a variety of places. Their data analysis has enormous potential to significantly change working methods, customer experiences and employee experiences for the better and to ensure economic success for companies. However, data analysis can only provide added value if it is analysed systematically and using state-of-the-art data analysis software in order to gain insights into how you can improve your products and services for the benefit of your customers.
Intelligent Data Analysis
- 1 Data analysis: explanation of terms
- 2 Applications of data analysis in a business context
- 3 Data analysis techniques
- 4 Benefits of data analysis
- 5 Steps to perform data analysis
- 6 Analysis dashboard: Data analysis software from QuestionPro
- 7 1:1 live online presentation: data analysis with QuestionPro
- 8 Test software for surveys, market research and experience management now for 10 days free of charge!
Data analysis: explanation of terms
Data analysis is the science of examining a data set, for example to draw conclusions from the information, to make important business decisions or simply to expand knowledge about different areas. Daniel Burrus, management consultant and speaker on business and innovation issues, says of the analysis: “A lot of this will help people work smarter and faster because we have data for everything that's happening right now.”
Applications of data analysis in a business context
Data analysis is used in many business areas. It provides those responsible with an important basis for making decisions, such as when a product should be brought onto the market or what the price of the product is. Below you will find examples of areas in which companies are increasingly using data analysis, mostly software-protected.
Data analysis in the field of marketing
In the field of marketing, researchers conduct data analysis to predict consumer behavior and place products and services in the market accordingly. For example, analyzing sales data can help you identify a portfolio of products or services that are not particularly popular or well-received by a particular demographic. The analysis can also give you deep insights into optimizing marketing campaigns to better connect with the target group and address their needs more precisely.
» Conduct market research with QuestionPro
Data analysis in HR
Companies use data analysis in the area of human resources to be able to offer their employees a good working environment and the best working conditions and to ensure high employee satisfaction. For this purpose, employee surveys or pulse surveys are usually carried out.
» Employee Experience Management with QuestionPro
Data analysis in the area of Customer Experience Management
Data analysis in the area of Customer Experience Management is primarily aimed at making customer experiences positive along the customer journey. The data is usually collected through touchpoint analyses, i.e. through surveys at the interface between customers and companies.
» Customer Experience Management with QuestionPro
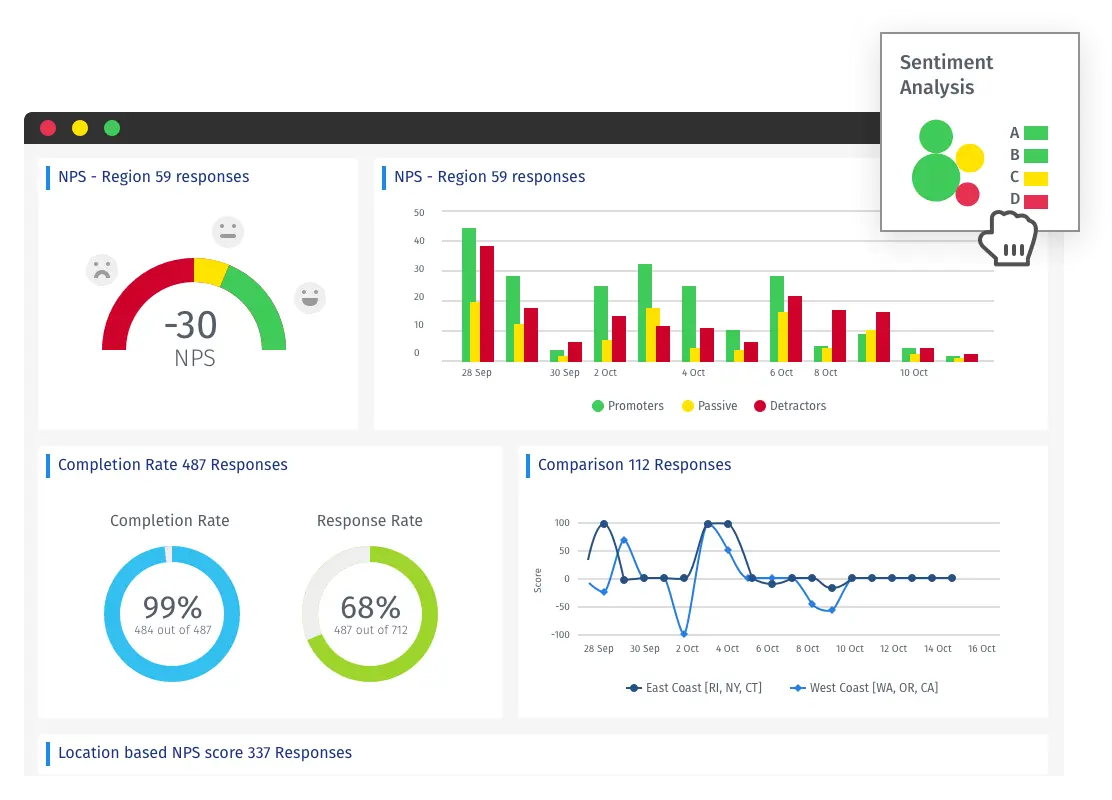
 Example of data analysis from the CX area
Data analysis techniques
In order to extract relevant insights from the raw data via data analysis, various techniques are used. These depend on the type of information collected. It is therefore important to define the method to be used before carrying out.
- Qualitative data analysis: Researchers collect qualitative data using underlying emotions, body language, and expressions. It is based on the interpretation of the verbal answers. The most common methods for obtaining this information are open interviews, focus groups (moderated group discussion), and observation groups, where researchers generally analyse patterns in the observations during the data collection phase.
- Quantitative data analysis: Quantitative data is presented in numerical form. They are based on tangible results.
The way you collect your data should relate to how you plan to analyse and use it. You also need to ensure that you collect accurate information that you can trust. There are many data collection techniques, but the most commonly used method by experts is online surveys. It offers significant advantages such as time and cost savings compared to traditional data collection methods.
Benefits of data analysis
- Make faster, more informed business decisions based on facts.
- Identify performance issues that require action.
- Gain a deeper understanding of customer needs, which in turn leads to better business relationships.
- Increase awareness of risks to take preventive measures.
- Visualize different dimensions of the data.
- Create significant competitive advantages through intelligent data analysis.
- Better understand the company's financial performance.
- Identify opportunities to reduce costs and thereby increase profits.
Qualitative analysis focuses on opinions, attitudes and beliefs. The questions start with: Why? How?
Example of qualitative data analysis: Panel discussions where customers are asked about what they like or dislike about the place.
Quantitative data analysis focuses on concrete data and information. Data is collected by asking questions such as:
How many? Who? How often? Where?
Example of quantitative analysis: Surveys that focus on measuring sales, trends, reports, or perceptions.

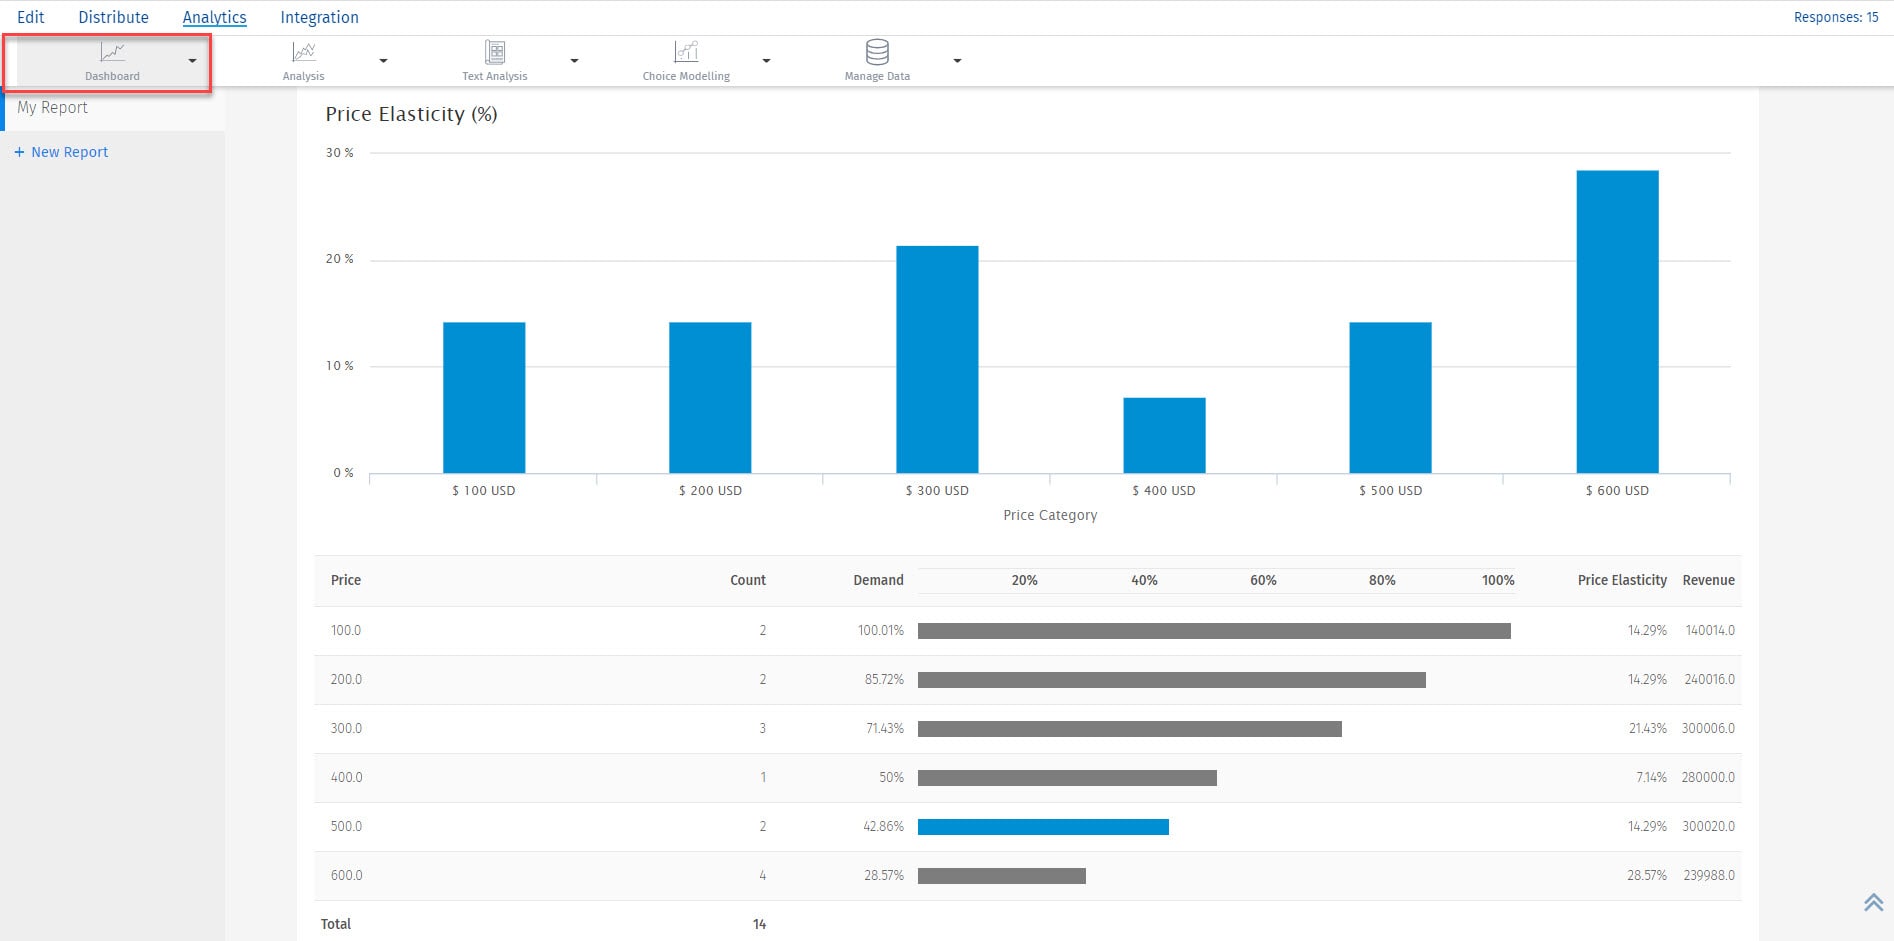
Easy data analysis
Steps to perform data analysis
Step 1: Define your questions
Start by choosing the right questions for your data analysis. Questions should be measurable, clear and concise. Design your questions to include or exclude possible solutions to your specific problem.
Step 2: Set measurement priorities
This step is divided into two sub-steps:
Decide WHAT you want to measure: Determine what type of data you need.
Decide HOW you want to measure them: Thinking about how you will measure your data is also important, especially before the data collection phase, because your measurement method will support or contradict your subsequent analysis.
Step 3: Collect data
After the question has been clearly defined and your measurement priorities have been determined, it is now time to collect your data for data analysis. As you collect and organize your data, keep these important points in mind:
- Before collecting new data, determine what information can be collected from existing databases or sources.
- Establish a storage and file naming system in advance so that all team members can collaborate. This process saves time and prevents team members from recording the same information twice.
- If you need to collect data through surveys, observations, or interviews, develop a questionnaire in advance to ensure consistency and save time.
- Enter the collected data into a log with the collection date and gradually add all sources.
Step 4: The actual data analysis
Once you've collected the data necessary to answer your question from Step 1, it's time to do deeper data analysis. Find relationships, identify trends, sort and filter your data by variables. As you analyse the data, you will find that you have obtained exactly the data you need. Ideally, for modern data analysis, you use software that supports you with data analysis quickly and easily using (partial) automation.
Step 5: Interpret the results
Finally, after analyzing the data and perhaps conducting further research, it is time to interpret the results. Ask yourself these key questions:
- Does data analysis answer your original questions? And how?
- Does the data help you defend any objections? In what way?
- Are there any limitations to the conclusions, any aspects that you did not consider?
If your interpretation of the data holds up under all of these questions and considerations, then you have likely reached a productive conclusion. The only step left is to use the results of data analysis to decide how you will act.
Analysis dashboard: Data analysis software from QuestionPro

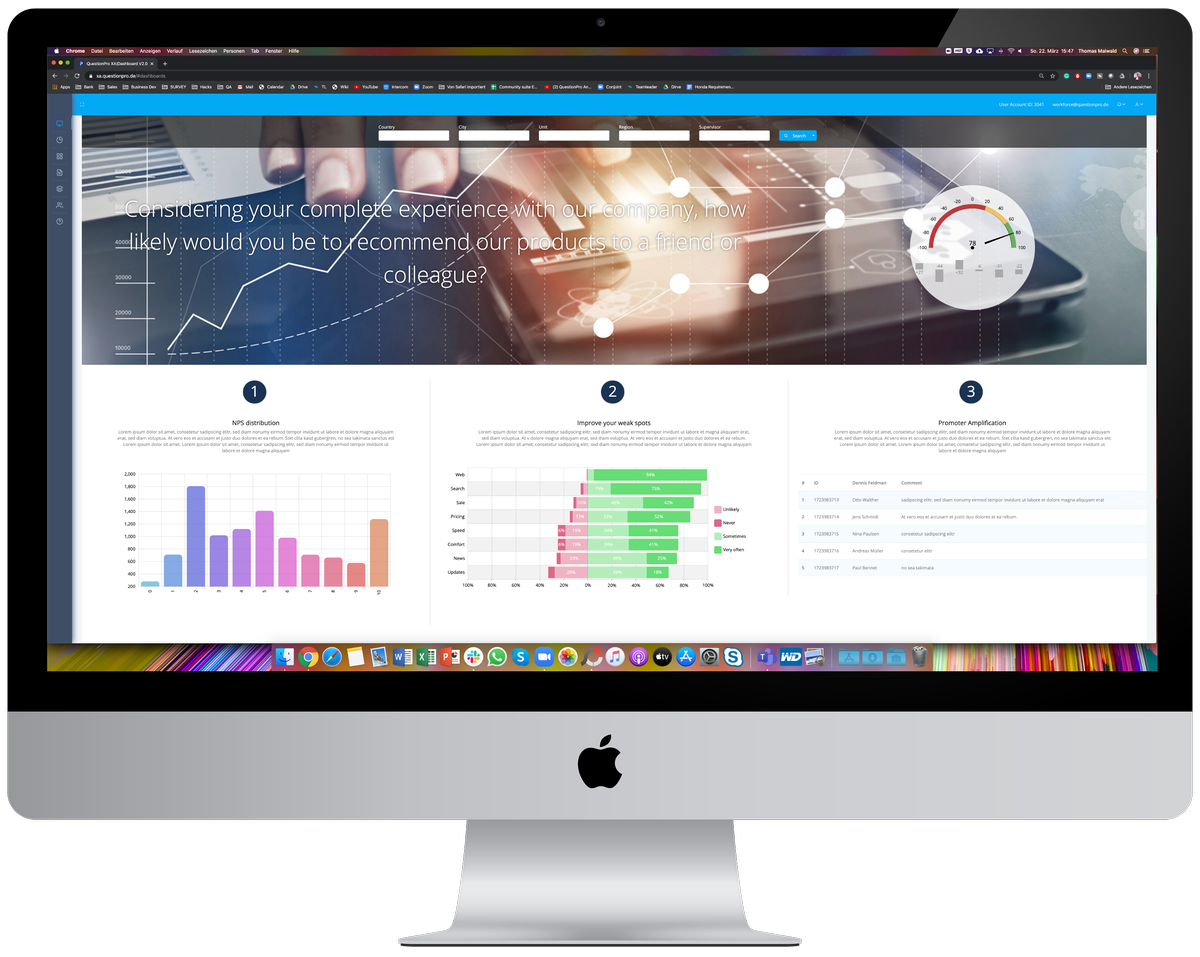
QuestionPro has an excellent real-time data analysis dashboard that makes data analysis quick and easy.
1:1 live online presentation:
Data analysis with QuestionPro
We would be happy to show you in a 1:1 live demo how you can carry out data analyses quickly and easily with QuestionPro!
Make an individual appointment now.
Test software for surveys, market research and experience management now for 10 days free of charge!
Do you have questions about data analysis? Simply contact us using the contact form. We look forward to speaking with you! You can also test QuestionPro for 10 days free of charge and without risk!
Test the agile market research and experience management platform for qualitative and quantitative data collection and data analysis from QuestionPro for 10 days free of charge
FURTHER KEYWORDS
SHARE THIS ARTICLE
KEYWORDS OF THIS BLOG POST
Intelligent Data Analysis | data | Analysis | Evaluation | Dashboard
FURTHER INFORMATION
- Conduct quantitative and qualitative market research with QuestionPro (Qual & Quant)
- Market research: examples, tips, data collection, data analysis, software for carrying out and presenting the results
- The big QuestionPro-Guide on the subject of customer surveys: definition, development, methods, examples, evaluation, template for import.
- Customer Experience Management: Tips, Tools, Best Practices
- Reputation management: tips, software, app
- Sentiment analyses and semantic text analysis based on artificial intelligence
- All information about the experience management platform QuestionPro
- Conducting employee surveys: A specialist article from QuestionPro


