Innovation Management
QuestionPro offers a highly effective and flexible tool for innovation analysis. QuestionPro's innovation management software reporting tools help administrators track the performance of their innovation program according to individual innovation requirements and needs
Innovation analysis
- 1 Our analysis approach is based on the four main methods we use to provide analysis data
- 2 Built-in reporting and analytics for your innovation management community
- 3 Web analytics integration
- 4 Data export for external innovation analysis
- 5 Optimized export of data for integration into business intelligence software
- 6 Info graphics
- 7 1:1 Live online presentation: Innovation analysis, reporting and tracking of ideas, innovations and engagement within QuestionPro's innovation management community
- 8 Try the community for market research and innovation management now for 10 days free of charge!
Our analysis approach is based on the four main methods we use to provide analysis data
- Built-In Reporting: Generate actionable insights in real-time. Track all activity, ratings and engagement live and make decisions based on real-time data.
- Web analytics integration: Integrate Google Analytics or other web analytics tools to track page views, sessions, user journeys, and other activities.
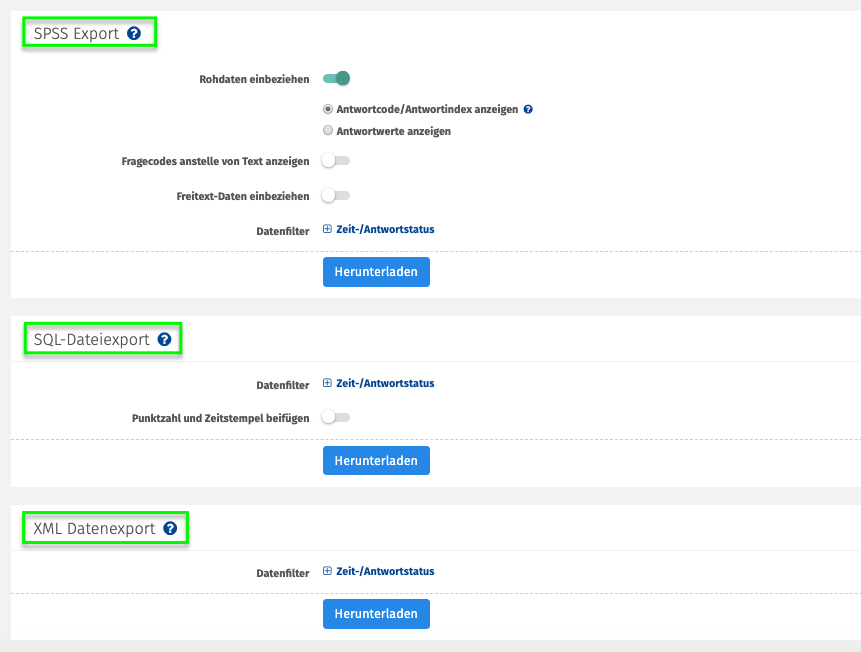
- Data Exports: Export your innovation management community's complete datasets so you can create custom reports
- Business intelligence integration: The export of the analysis data enables automatic transfer to your BI software and is formatted so that the data can be aggregated across tables.
- Infographics: QuestionPro also offers infographics for analysis in innovation management, which can be generated at the push of a button and can be easily integrated into presentations.

Built-in reporting and analytics for your innovation management community
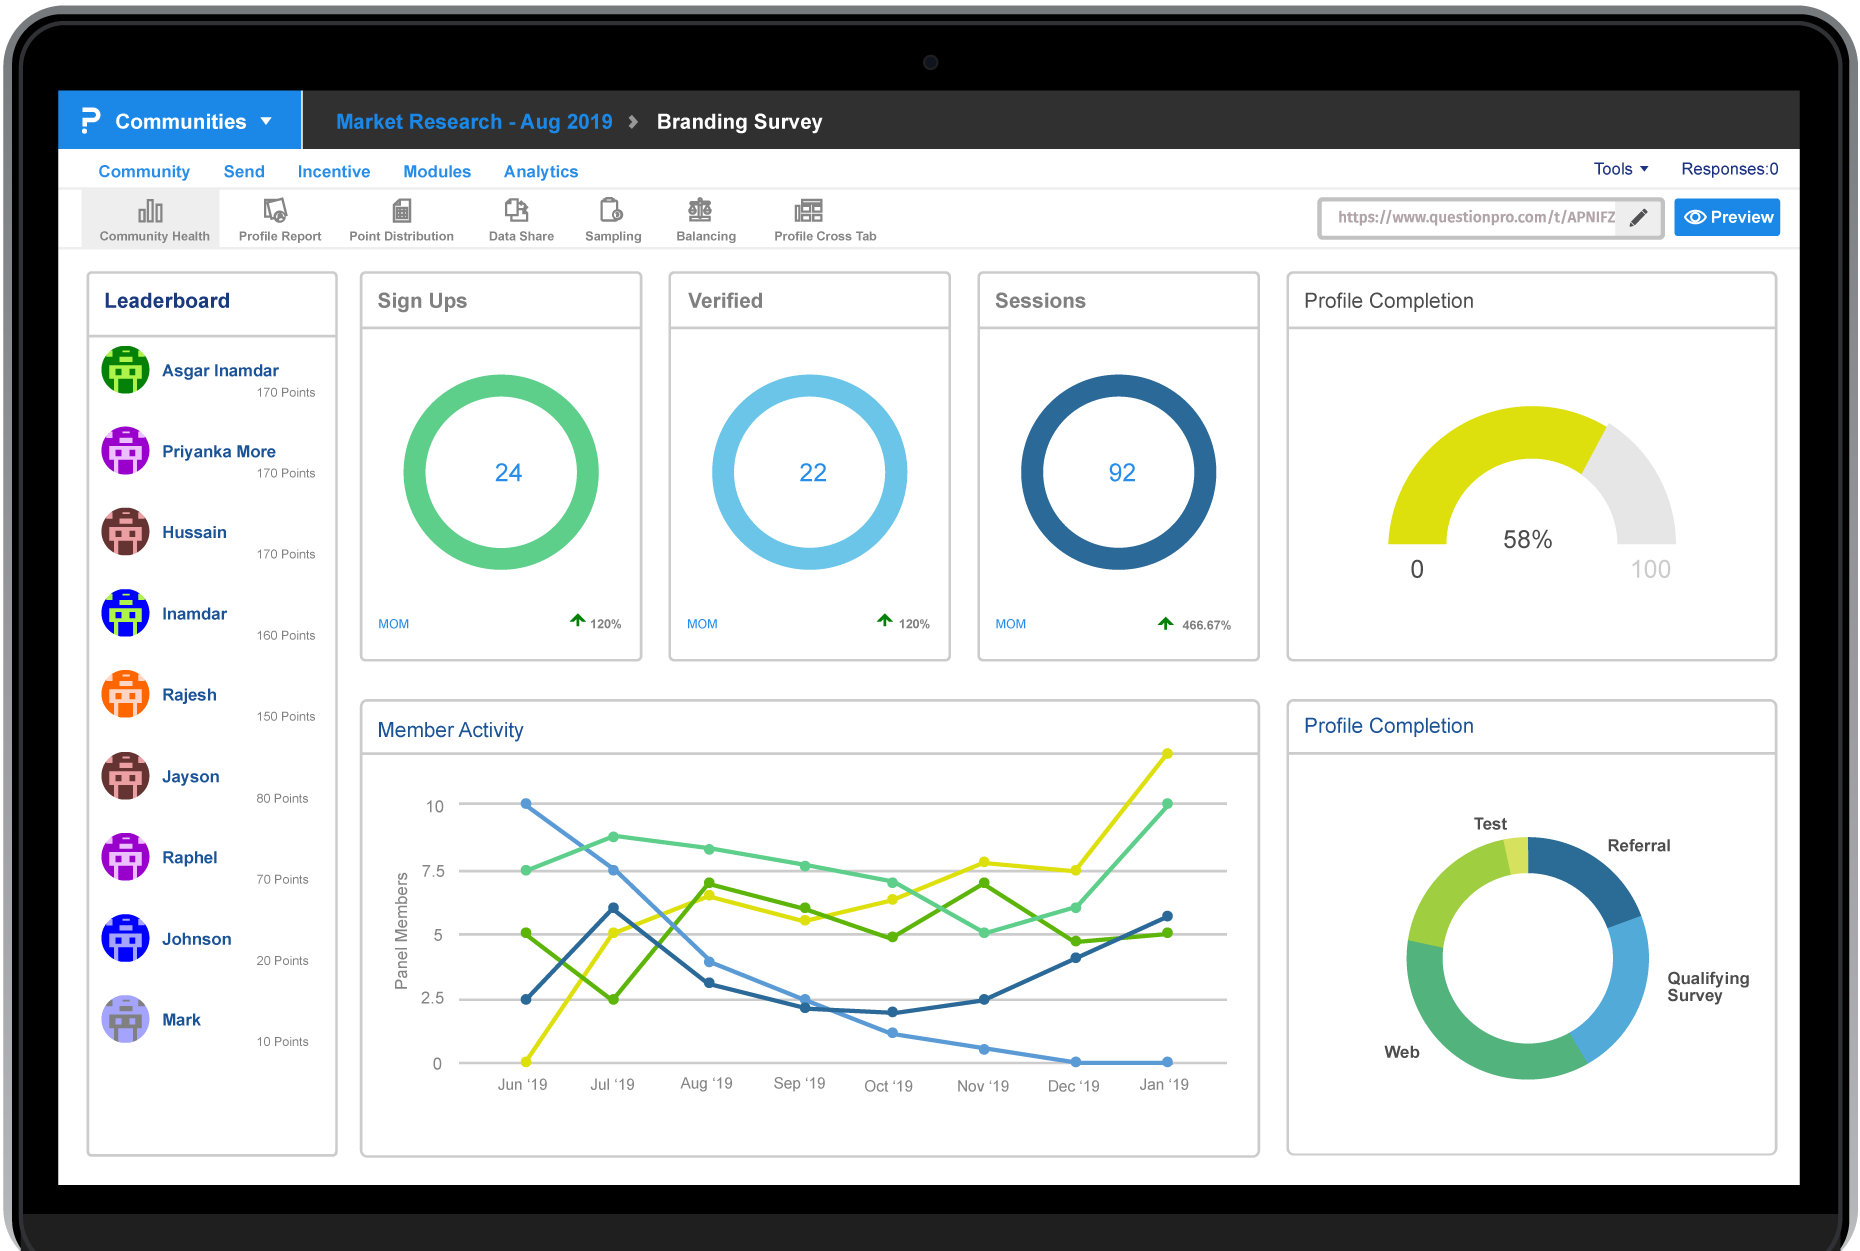
QuestionPro innovation management software's built-in reports provide all the key data you need to run your innovation community, including key engagement trends, tracking of completed ideas, and automatic alerts when community engagement slows, through a clearly designed innovation dashboard. The new reporting feature offers three features:
- Engagement: Focus on carrying out key actions such as idea submission, voting, commenting, staging actions and moderation activities
- Results: Focus on selecting and implementing ideas
Innovation Assistant: Alerts and tips to help you engage your audience and get results - Score reports are not available at all subscription levels. If you are interested in upgrading, contact one of our QuestionPro specialists.
Engagement dashboard
The engagement dashboard allows admins to quickly and easily review their campaign's overall activity and see what percentage of users are taking key actions. This data helps you make decisions in real time. Do you have high visitor numbers but few ideas? Try to target existing users with content that encourages submissions and makes it seem more accessible.
Moderation dashboard
Are you trying to distribute work within a team? Administrators can also monitor moderator activity over time and break it down by innovation campaign or group. Make sure there is at least one moderator action per idea and ensure that certain campaigns are not missed in activity trends using the moderator actions activity type.
Results dashboard
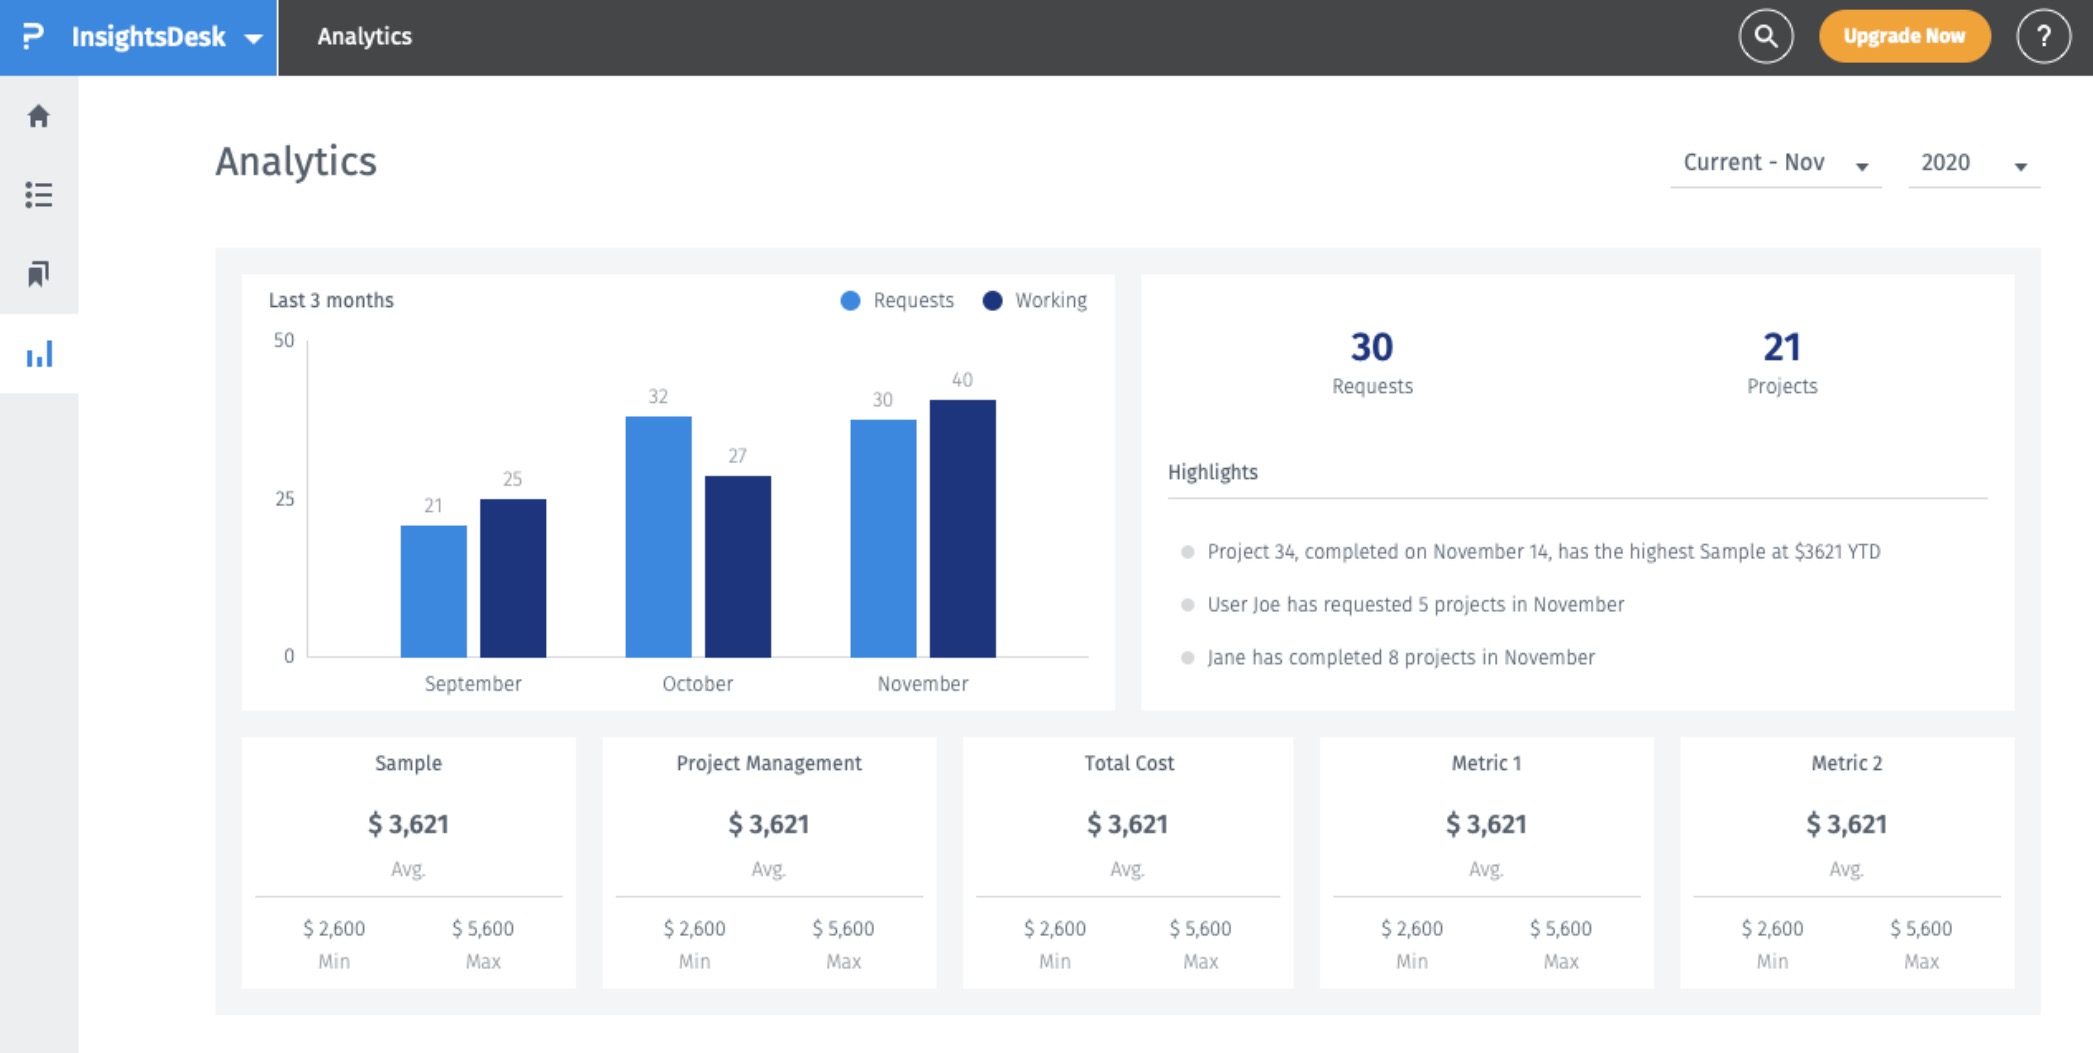
The Results Dashboard focuses on what emerges from your idea collection and management efforts. You can track both the number of ideas selected and completed so you can ensure implementation. Use this to set a strategy for implementation and provide a great summary of achievements at the end of each year.

Innovation Assistant
Finally, QuestionPro Reporting includes a built-in innovation assistant that monitors activity within the innovation management community and flags any slowdowns in participation. These alerts are also sent to your QuestionPro representative so that both your team and our team are always up to date on what is happening in your community and what action is needed.
Web analytics integration
QuestionPro enables Google Analytics integration with a single action: simply paste your analytics tracking code into the community. Google Analytics offers a market-leading community tracking suite that provides a range of additional data. Highlights include tracking visitor geolocation and conducting cohort analysis.
By integrating with purpose-built web analytics products, the QuestionPro innovation management platform can provide great insight into how your community is being used. Most importantly, you can track where in the world your visitors come from, how many daily active users you generate, and the behavior of users in your community.
Break down web analysis down to the idea level
Uniquely, QuestionPro also offers the ability to track key custom dimensions of community usage using Google Analytics. This means that Google Analytics users can break down all of their reports by user roles (admin, moderator, and user) and by the number of ideas submitted.
Data export for external innovation analysis
QuestionPro provides simple, actionable reports to help your teams effectively monitor the ongoing performance of their innovation management community. However, there are good reasons to export data from the community for external innovation analysis using statistical tools,
Optimized export of data for integration into business intelligence software
Exports are most commonly used to check community data or innovation campaigns with external statistical tools. Data exports can be downloaded at any time so that the data you need is always available.
QuestionPro has optimized its entire community export to allow easy use of business intelligence tools. This is achieved through two key features:
- The ability to set up an automatic export of iterative data to your own database.
- Structuring the data around a central event table that enables cross-table analysis of the data in almost any desired configuration.
Using these two key features, companies with an established BI suite can create a range of custom reports tailored to their use case and integrated with the rest of their business reporting.
This solution is aimed at QuestionPro's power users and enables large companies to integrate innovation planning into their standard business planning. Additionally, the scheduling features provide the tools to update custom reports daily, providing the ability to create custom reports in near real-time.

Info graphics
The so-called infographics are very popular with our customers. With a mouse click, a graphic is generated that includes all aspects of the community and is also more individualized. The infographics are used for presentation purposes. Below you will find examples from the infographic that is part of QuestionPro's innovation analysis mode.

1:1 live online presentation:
Innovation analysis, reporting and tracking of ideas, innovations and engagement within QuestionPro's innovation management community
Make an individual appointment now.
Try the community for market research and innovation management now for 10 days free of charge!
Do you have any questions about the content of this blog? Simply contact us via contact form. We look forward to a dialogue with you! You too can test QuestionPro for 10 days free of charge and without risk in depth!
Test the agile market research and experience management platform for qualitative and quantitative data collection and data analysis from QuestionPro for 10 days free of charge
FURTHER KEYWORDS
SHARE THIS ARTICLE
KEYWORDS OF THIS BLOG POST
Innovation Management | Analysis | Innovation analysis


