Market research & sampling
Do you know how many people need to take part in your survey or market research study so that you get a representative result? Use our sample calculator to quickly and easily calculate the ideal sample size. If you prefer to determine the size of your sample yourself, we will show you the formula behind calculating a sample and what you need to consider. You will also learn what types of samples there are and what a sample actually is.
Calculate sample size
- 1 What is a sample?
- 2 Use sample calculators to calculate the sample size
- 3 Types of Sampling: Sampling Method
- 4 1:1 Live online presentation: Determine sample size with QuestionPro's sample calculator and start a panel study in seconds
- 5 Try software for market research and experience management now for 10 days free of charge!
What is a sample?
Definition of the term sample
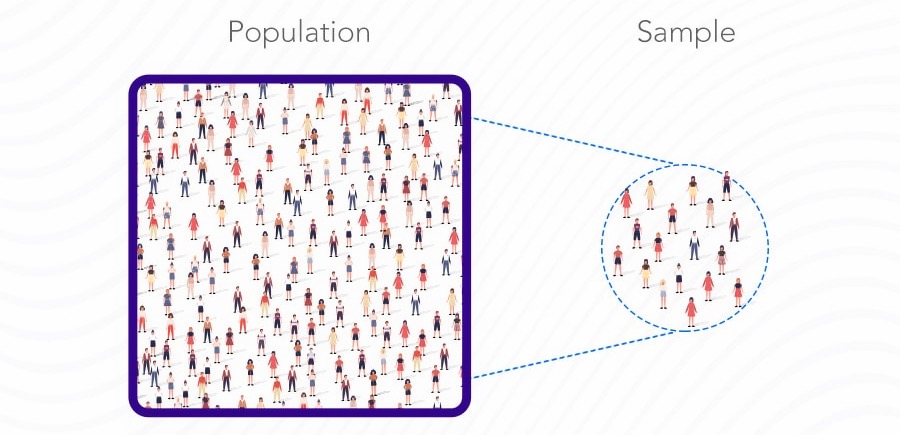
A sample is defined as part of a larger population that market researchers select and put together using a predefined selection process. This selection is also referred to as sampling points, sampling units or observation units. Typically, it is hardly possible or very costly and time-consuming to examine the entire population when conducting a survey or market research study. Therefore, a sample is selected from the population from which conclusions can be drawn about the entire population. Calculating the sample size is not trivial, but in the course of this blog article we will discuss the sample calculation formula. We also provide you with a sample calculator.

The sample is a selected part of the population and can be calculated exactly using a sample calculator.
Example of using a sample
A company in the mobile communications industry would like to conduct a market research study on the most popular and frequently used functions of smartphones among students in Germany. There are now around 2,9 million students in Germany, of course not all of whom can be surveyed. The company thus selects a representative size from all students, i.e. a sample, in order to be able to draw conclusions about the population from this sample. In order to be able to draw conclusions about the population from the sample, the sample must have a certain representative size.
At what size is a sample representative?
There is no general answer to the question of when a sample has reached a representative size. Several factors play a role here.
- Size of the population:
The population indicates how many people meet the demographic requirements for your market research study. The population of all students in Germany is 2.9 million. - Confidence level (confidence level):
The confidence level indicates how certain you can be that your data is reliable. It is expressed as a percentage and is aligned with the confidence interval. If your confidence level is e.g. For example, if it is 90%, your results are most likely 90% correct. - Margin of error (confidence interval):
It is impossible to be 100% accurate with surveys. Confidence intervals indicate how far the data can deviate from the population mean. An error interval describes how close you can reasonably expect a survey result to be relative to the actual population value. - Standard deviation: The standard deviation is the measure of the spread of a data set from its mean. It measures the absolute variability of a distribution. The higher the spread or variability, the larger the standard deviation and the greater the magnitude of the deviation.
Sample size calculation
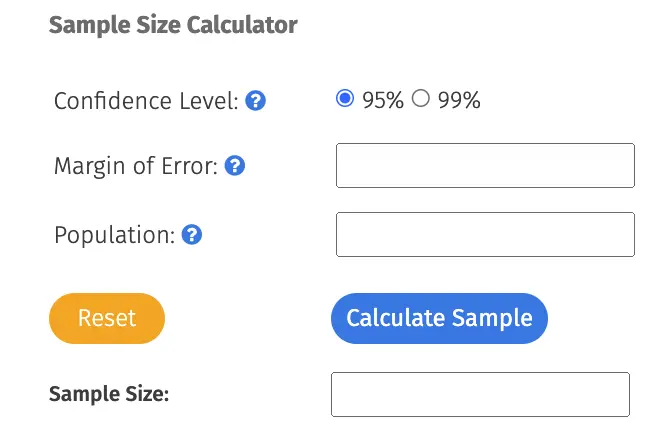
The easiest way to calculate the ideal sample size is to use a so-called sample calculator, which already contains the formula for calculating the size of the sample. After entering the desired confidence interval, the size of the population (population size) and the margin of error, the ideal sample size for the survey is calculated.
Confidence level
With the confidence level becomes determines the probability with which the population is reflected, i.e. represented, by the calculated sample. The higher the percentage confidence level used in the sample calculator, the more reliably the results in the sample represent the population. However, the required sample size also increases with the height of the confidence interval.
Margin of error
The margin of error shows the expected deviations from the results of the sample to the population. By opting for a smaller margin of error, you get a more accurate result. However, a larger sample size must be expected.
Size of the population (population size)
The population size is the population of people to be examined. This can be, for example, the population in Germany or the German-speaking population in Germany or a specific customer group or people 60+. If there is no exact data about the number or if the number cannot be determined, an estimated value is entered here.
Before the sample size is determined using the sample calculator, the basics of the survey should be thoroughly researched. Samples that are too small can lead to inaccurate results that do not add value or do not produce statistically significant results. Samples that are too large are very costly, without the large sample size offering any real added value.
The statistical significancez provides information about how high the risk is that the results of the survey in the sample taken were created by chance. In general, a large sample size also results in higher statistical significance.
For the sake of completeness, we would like to go into the formula for calculating the sample size in more detail below and clarify it using an example.
Formula and example for calculating sample size
Your confidence level corresponds to a Z-score. This is a constant value needed for this equation. Here are the Z-scores for the most common confidence levels:
- 90% – Z-score = 1,645
- 95% – Z-score = 1,96
- 99% – Z-score = 2,576
Now to calculate the size of your sample you will need the following formula:
Required sample size = (Z-Score)2 * StdDev*(1-StdDev) / (Margin of Error)2
Let's stick with the example of the mobile phone company, which wants to determine the most popular and most used functions of a smartphone among students in Germany.
- The population of all students in Germany is 2.900.000
- The confidence level should be 95%
- The margin of error (confidence interval) may be 3%
- So the mobile phone company must at least 1067
- With a higher error margin (confidence interval) of, for example, 5%, the company only has to 385 Survey students to draw conclusions about the population.
- However, if the company wants to have as low a standard deviation as possible and uses a confidence level of 99% and a margin of error of 1% when calculating the size of the sample, then the company must 16483 Interview students.
Use sample calculators to calculate the sample size
Is working with a formula too complicated to calculate the size of a sample? It actually is! And if you don't want to memorize the formula because you don't regularly calculate a sample size, simply use QuestionPro's sample calculator. The formula for calculating the sample size is already included in QuestionPro's simple sample calculator, so all you have to do is adjust the confidence level and the confidence interval and enter the population. With QuestionPro's sample calculator you can quickly and effectively determine the sample size for your next survey or market research study and save yourself a lot of time and calculations.

There are many different methods for creating a sample. With virtually all sampling methods, the sample size can be calculated using a sample calculator without much effort
Types of Sampling: Sampling Method
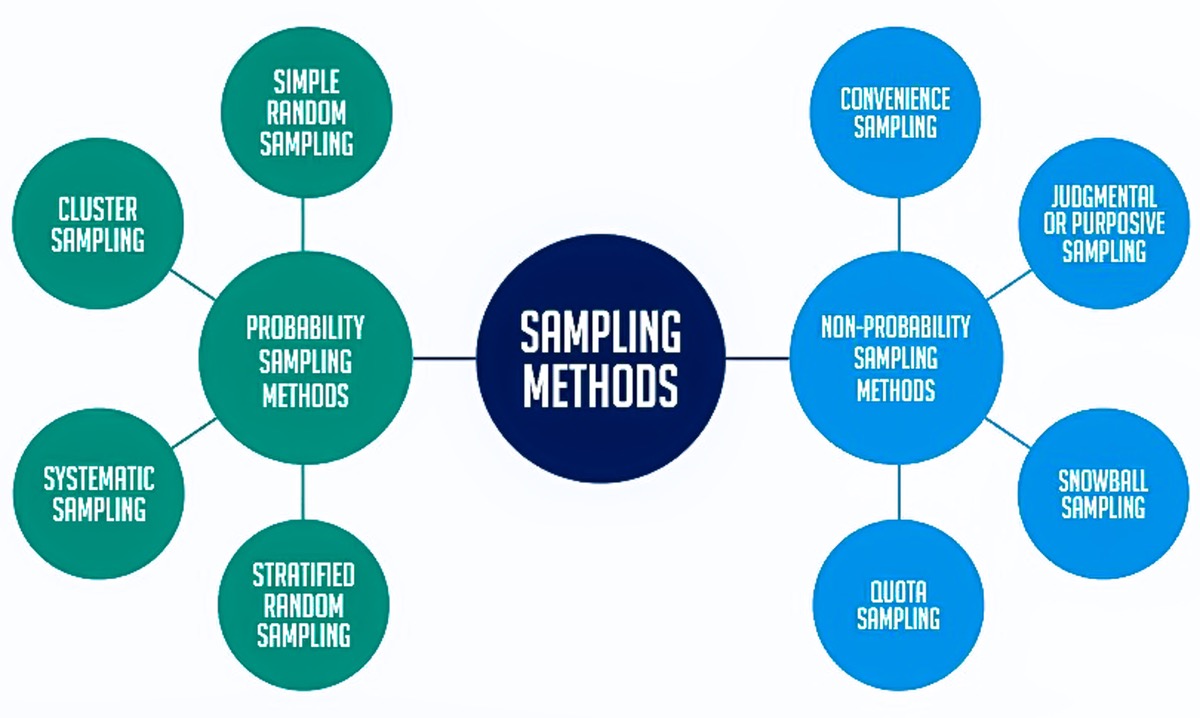
There are two basic types of sampling in market research: probability sampling and non-probability sampling. Let's take a closer look at these two sampling methods.
- Probability sampling
Probability sampling is a sampling method in which market researchers set defined criteria and randomly select participants from a population based on these defined criteria. With these selection parameters, all participants have the same probability of being part of the sample. - Non-probability sampling
In non-probability sampling, market researchers select the sample randomly. This sampling method is not a fixed or predefined selection process.
Types of Probability Samples
Probability sampling is a sampling technique in which researchers select samples from a larger population using a method based on probability theory. In this sampling method, each member of the population is taken into account and the samples are formed based on a defined process.
For example, in a population of 1000 members, each member has a 1/1000 chance of being included in a sample. Probability sampling eliminates bias in the population and gives all members a fair chance of being included in the sample.
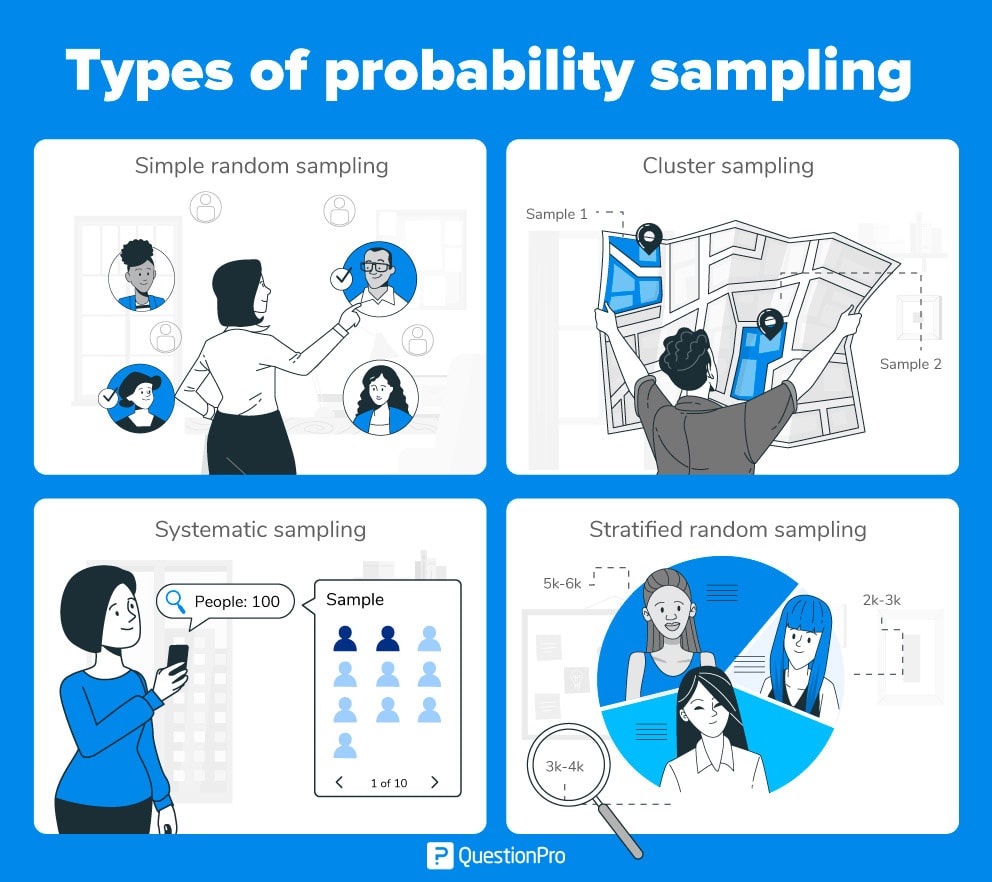
There are four types of probability sampling techniques:
-
Simple random sampling
One of the best methods of probability sampling that saves time and resources is simple random sampling. This is a reliable method of obtaining information in which each individual member of a population is randomly selected. Each individual has an equal probability of being selected as part of a sample.
-
Cluster sampling
Cluster sampling involves dividing the entire population into sections or clusters that represent a population. From these clusters, participants in the sample identified based on demographic parameters such as age, gender, location, etc. are included. For example, if the United States government wants to determine the number of immigrants living in the mainland United States, it can divide them into clusters based on states such as California, Texas, Florida, Massachusetts, Colorado, Hawaii, etc.
-
Systematic sampling
With systematic sampling, market researchers select the sample members of a population at regular intervals. This method requires choosing a starting point for the sample and a sample size that can be repeated at regular intervals. This type of sampling method has a predefined size and is therefore the least time-consuming method.
An example: Market researchers intend to collect a systematic sample of 500 people in a population of 5000. To do this, the individual elements of the population are numbered from 1-5000 and every 10th person is selected as part of the sample (population/sample size = 5000/500 = 10). -
Stratified random sample
Stratified random sampling is a method by which market researchers divide the population into smaller groups that do not overlap but represent the entire population.
For example, market researchers who want to analyse the characteristics of people with different annual incomes create strata (groups) based on annual family income. Eg – less than 20.000 euros, 21.000 to 30.000 euros, 31.000 to 40.000 euros, 41.000 to 50.000 euros, etc.

Types of Non-Probability Samples
In most cases, the result of a survey conducted with a non-probability sample will produce biased results that may not represent the desired target population. However, there are situations, e.g. B. in the initial stages of research or due to cost constraints in conducting research, where non-probability sampling is much more useful than the other types.
The following four types of non-probability sampling better explain the purpose of this sampling method.
-
Random sample
This method relies on easy access to test subjects, e.g. B. surveying customers in a shopping center or passers-by on a busy street. It is usually referred to as convenience sampling because it is easy for the researcher to create such a sample and contact the subjects. Market researchers have virtually no ability to select the sample elements, and selection is based solely on proximity rather than representativeness.
-
Judgmental or purposive sampling
Judgmental or targeted samples are formed at discretion. Market researchers only take into account the purpose of the study and the interest of the target audience. Selection criteria are then, for example: “Are you interested in doing your master’s in…?”, and those who answer “No” are excluded from the sample. In online surveys, such a sample can be easily formed using so-called screener questions by first asking all people whether they meet certain criteria, such as: Are you a student?; Drive a car; Do you own a condominium, etc. If the screener question is answered positively, respondents will be added to the sample.
-
Snowball sampling
Snowball sampling is a sampling method that market researchers use when it is difficult to identify target individuals for selecting a sample. For example, it is extremely difficult to interview homeless people or illegal immigrants. Snowball sampling as a sampling method is used in situations in which the topic of a study is highly sensitive and is not readily discussed openly. In such cases, with the help of snowball sampling, a few people can still be identified who are available for such surveys, namely by first asking friends and acquaintances whether they have access to people from a certain group of people, who then in turn have access to other people in the group target group have access.
-
Quota sample
In quota sampling, the selection of members in this sampling method is based on a predetermined standard. In this case, since a sample is formed based on certain characteristics, the sample formed has the same characteristics as the population. It is a very quick and easy sampling method.
1:1 live online presentation:
Determine the sample size with the QuestionPro sample calculator and start the panel study in seconds
With QuestionPro's sample calculator you can quickly and easily calculate the size of a sample for a market research study or survey. To carry out your study or survey, we also offer you an online panel of more than 22 million participants worldwide, which will certainly contain the sample you calculated. We will show you how easy it is to carry out a panel study with the sample you calculated using QuestionPro.
Make an individual appointment now.
Try software for market research and experience management now for 10 days free of charge!
Do you have any questions about the content of this blog? Simply contact us via contact form. We look forward to a dialogue with you! You too can test QuestionPro for 10 days free of charge and without risk in depth!
Test the agile market research and experience management platform for qualitative and quantitative data collection and data analysis from QuestionPro for 10 days free of charge
FURTHER KEYWORDS
SHARE THIS ARTICLE
KEYWORDS OF THIS BLOG POST
Sample calculator | Sample size | costs easily | calculation | sample
FURTHER INFORMATION
- Conduct quantitative and qualitative market research with QuestionPro (Qual & Quant)
- Market research: examples, tips, data collection, data analysis, software for carrying out and presenting the results
- Agile market research with QuestionPro. Use qualitative and quantitative methods on a single platform
- What does river sampling mean?


