Evaluate survey data
QuestionPro, offers you many options Evaluation of survey data with charts and attractive graphics. Here we will show you how to quickly and easily create a radar chart, also known as a network chart
Create radar chart & network chart
- 1 Radar diagram & network diagram: Evaluation options for your online survey with QuestionPro
- 2 Create a radar chart quickly and easily with the QuestionPro survey software
- 3 Tips for large-scale radar charts
- 4 1:1 live online demo: Create radar diagrams & network diagrams conveniently, quickly and easily with the QuestionPro survey software
- 5 Create surveys for free with the professional and web-based survey software QuestionPro
Radar diagram & network diagram: Evaluation options for your online survey with QuestionPro
The graphical representation form we present to you today has many names:
- Network diagram
- Spider web diagram
- Kiviat diagram
- Radar diagram
- Smartspider graphics or else
- Star diagram
All these terms mean one and the same thing, namely the representation of multiple values of the same categories in the form of a spider web. Radar charts thus offer you the possibility of presenting multivariate data in the form of a two-dimensional diagram of three or more quantitative variables in a simple and clear way.
Create a radar chart quickly and easily with the QuestionPro survey software
QuestionPro naturally offers the radar diagram as standard within its evaluation module, so that it can also be used in the free version. QuestionPro creates radar diagrams and network diagrams fully automatically, so that users of the globally popular survey platform for creating and analyzing online surveys do not have to laboriously develop them themselves.
We will now show you by means of an example how you can generate data for display within a radar chart and display the evaluation in the analysis dashboard. For this purpose, we will provide you with the corresponding sample questionnaire and the sample evaluation of the network diagram further below.
Creating questionnaires
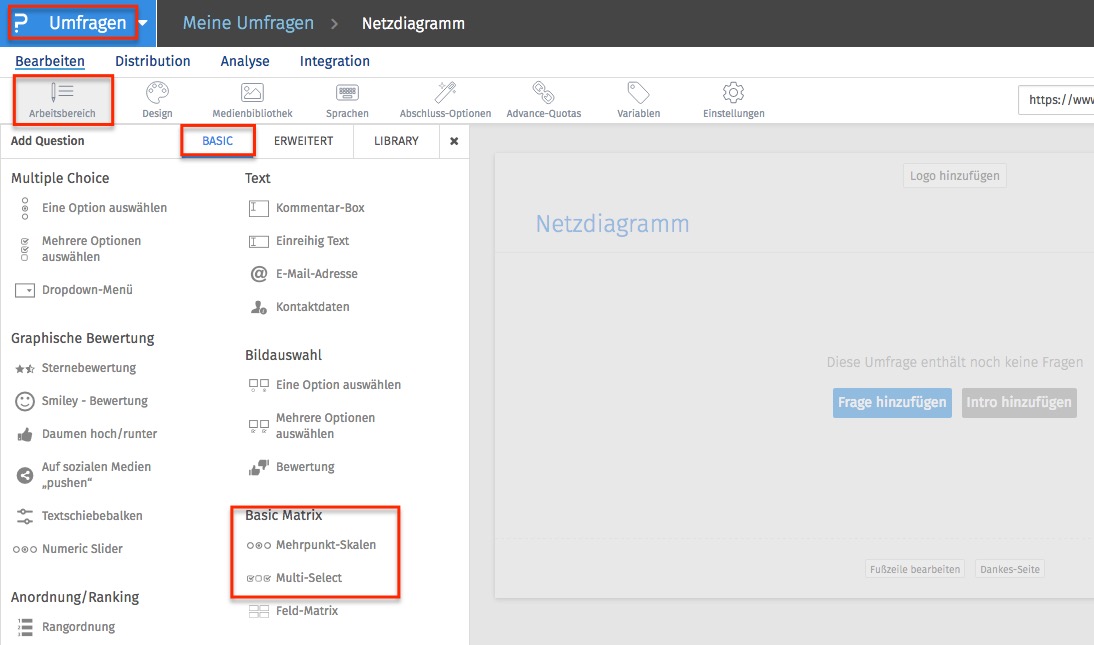
First, you select a question of type BASIC MATRIX within the QuestionPro questionnaire editor.
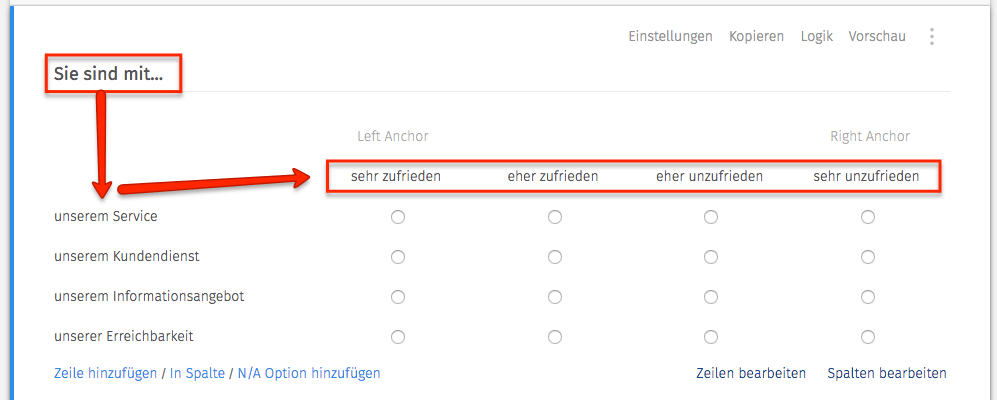
We have selected the question type Multipoint Scales for this example. Now define the question and the corresponding answer options within the editor.
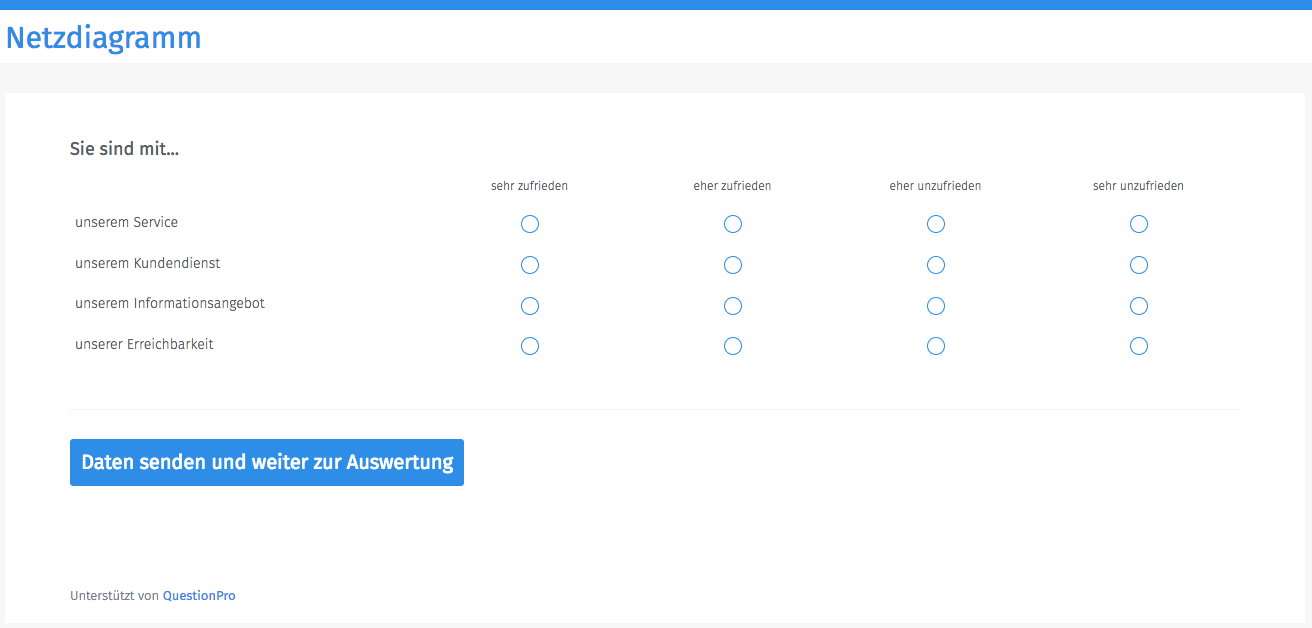
In the preview, the questionnaire looks like this.
Now you have to publish your questionnaire and wait for the corresponding data to be returned. You can also use the questionnaire as a data entry mask and enter the desired values yourself to create a network diagram. As soon as you receive the first data return or have entered the first data yourself, the radar chart is active.
Radial chart & radar chart view
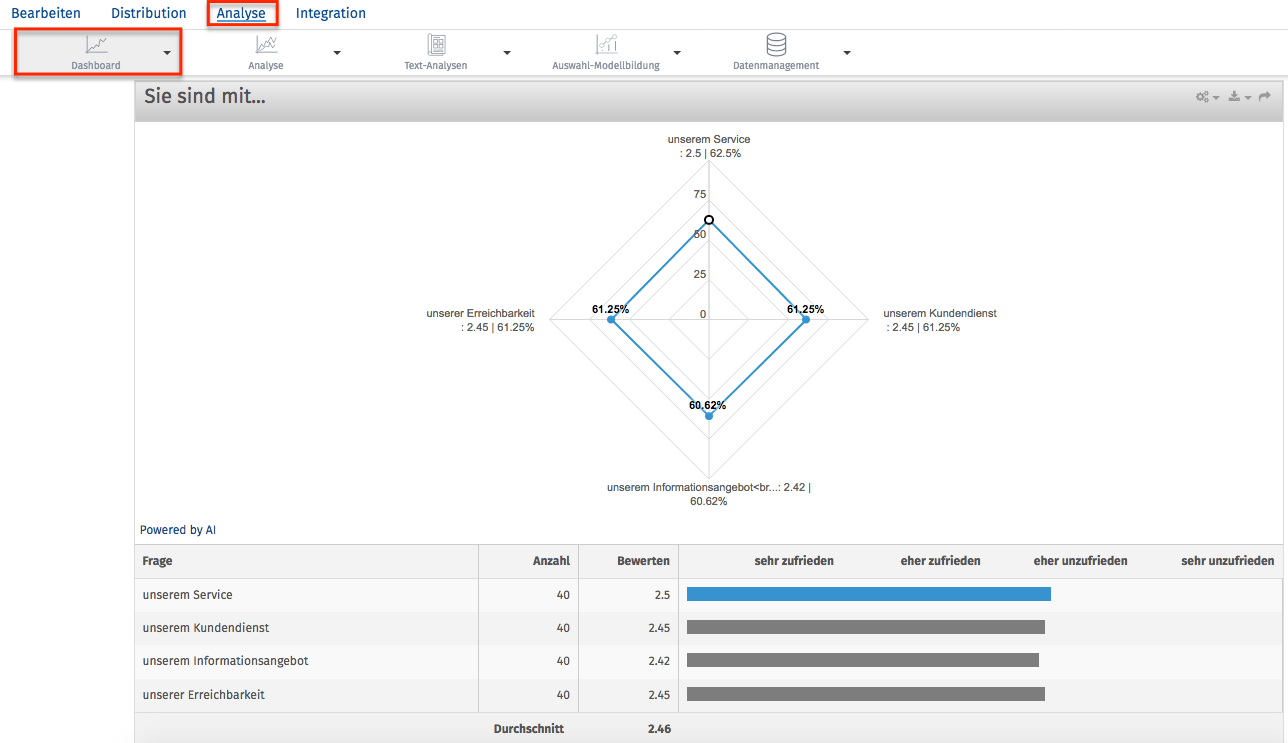
You can access the analysis by clicking on ANALYSIS within your survey. Here you will see the radar chart together with the survey data.
Tips for large-scale radar charts
It is important to know that the radar chart can quickly become confusing if too many variables are used. From practical experience, we therefore recommend that you use a maximum of 10 questions, although this should actually already be the clear upper limit.
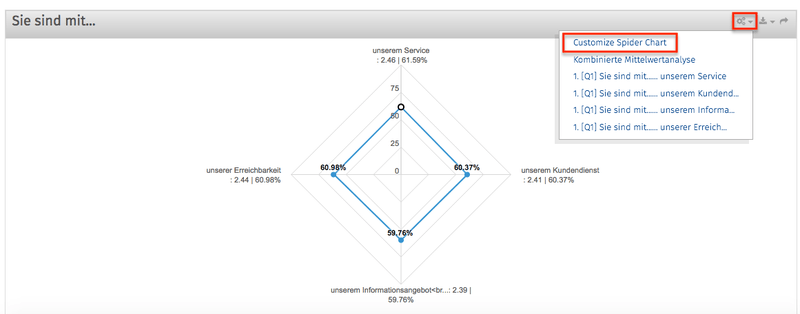
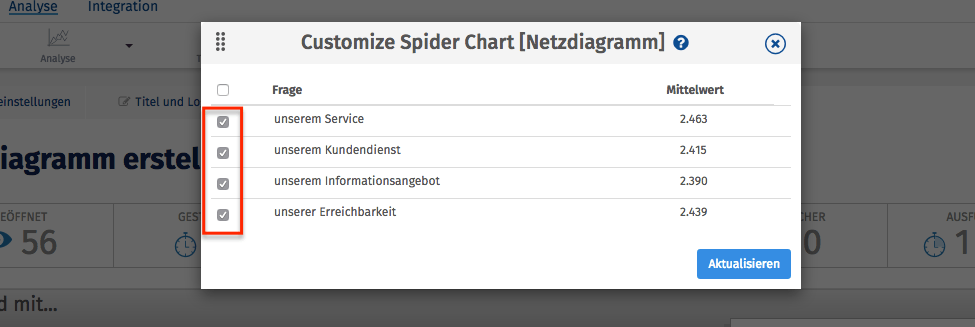
In case you still want to compare a lot of variables within a matrix, we have developed a solution to create network charts in comprehensive matrix tables using an artificial intelligence based algorithm. By default, the radar chart displays a combination of the Top 5 and Bottom 5 variables based on the mean values, and the rest is "hidden". However, you can customize the network chart in the dashboard settings and select those variables you want to be displayed. IMPORTANT: This algorithm is used only when the number of variables exceeds 10. If the variables are equal or less than 10, all variables with mean value will be displayed within the radar chart.
Within the reporting dashboard, click on the gear icon of the radar chart and select "Customize Spider Chart".
After that, you simply select those variables that you want to compare within the radar chart.
Example questionnaire and example analysis of a network diagram or radar diagram
→ Here it goes to the example questionnaire. If you click on the “Send” button within the questionnaire, you will be taken to the full view of the radar chart analysis.
1:1 live online demo:
Create radar diagrams & network diagrams conveniently, quickly and easily with the QuestionPro survey software
Would you like to learn more about QuestionPro and how you can quickly and easily create a radar chart or radar chart? We would be happy to show you the features and question types of the QuestionPro survey software in a personal 1:1 live online demo. Arrange an individual appointment now.
Create surveys for free with the professional and web-based survey software QuestionPro
You have any questions or suggestions? We look forward to your inquiry! Simply use the contact formto get in touch. Register now for free and create your first online survey with QuestionPro.
FURTHER KEYWORDS
SHARE THIS ARTICLE
KEYWORDS OF THIS BLOG POST
Radar diagram | Survey data | Evaluation | Analysis | questionnaire


