Market research
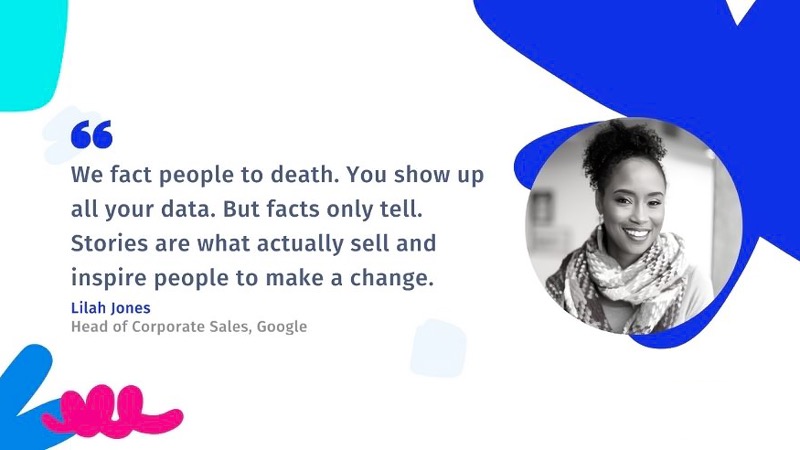
We invited Lilah Jones, Head of Sales North Central US at Google, to our recent global XDay to talk to her about how she uses data storytelling to convince people. You will also find valuable tips for telling stories based on data.
Data Storytelling
- 1 Lilah Jones, Google
- 2 What is data storytelling?
- 3 Data storytelling: ideas for implementation
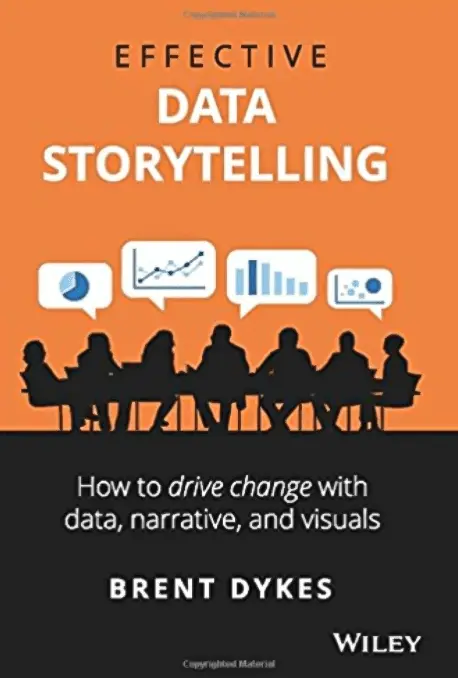
- 4 Book tip: Effective Data Storytelling. How to Drive Change with Data, Narrative and Visuals
- 5 1:1 live online presentation: Collect and analyse qualitative and quantitative data with the market research platform QuestionPro
- 6 Try software for market research and experience management now for 10 days free of charge!
Lilah Jones, Google
QuestionPro regularly holds an online event that is very well received under the label XDay. Interesting people from well-known companies and organizations share their thoughts with the participants and give exciting insights into their work, their visions as well as practical tips. In our last event we invited Lilah Jones from Google.
Remarkable career
Lilah Jones has had an impressive career. She studied Strategic Management at Suffolk University and completed her studies with a Masters in Business Administration. She started her career at Microsoft and after 7 years moved to Oracle as an Area Sales Manager. Before joining Google, Lilah Jones was a senior strategic account manager at EMC for two years and held a position as a lecturer and lecturer at the university where she laid the foundation for her career. So a home game.
Lilah Jones loves data
Lilah is now responsible for sales at Google for the North Central US region. Lilah told us that she loves data, so much so that she tracks and analyses her health, fitness, and sleep patterns daily using a dashboard. For the charming and articulate Lilah, data is extremely important because she believes that data changes our behavior.
It is not always easy to convert data into decisions
One of the most important steps in research is disseminating the data and findings to the right stakeholders. However, they may have difficulty understanding and accepting the findings in the same way as market researchers or analysts. Most companies try to build a data-driven culture, but they find it very difficult to translate data into decisions. Contrary to the popular misconception that it's all about tools and processes, people are a major barrier to adopting a data-driven approach.
Facts sell – stories sell
Raw data is boring and doesn't inspire anyone to take action! Stories inspire people to change. And so data must become a story if we intend to use insights from data to create behavior change. As a culture, we are wired to enjoy stories. Take, for example, films or Netflix series. To be watched, they have to tell a good story. So make sure your story resonates and inspires those involved. The story is just as important as the data itself. Presenting your data points without a good story is like trying to drive from one destination to another with a map and no gas in the car.
Stories are remembered 22 times more than pure facts.
We tend to remember and act on data anchored in a story. People often make emotional decisions, and emotions are often evoked through stories. Stories attract the person being persuaded far more than pure data.

What is data storytelling?
Data storytelling is the art of developing and ultimately telling a dramaturgically exciting story from raw data that actually reaches and appeals to its target audience. Lilah Jones believes that everyone needs to hear stories at some point. If we can listen to a story, we can tell a story. This is a skill that can be developed with practice. A good data story has context, narrative, data, and visual design. She went even deeper and explained how to write a good story around data.
6 practical tips from Lilah Jones for telling a compelling data story
- Listening: Do you know your audience? Who are you? What is important to you? What goals do they pursue? Your audience must actually be interested in the data you present. Otherwise there is no point in telling this story
- Refine and condense: Focus on the data that is really important and relevant. List the key points that are interesting and actionable for your audience.
- Storyboard: Research the data thoroughly and look for a natural timeline so that your story also has a beginning and an end.
- Design: Come up with an attractive and clean design and a visualization that looks convincing and professional.
- Get feedback: Question your assumptions and insights and find inconsistencies and blind spots. Obtain feedback from relevant stakeholders. Use your social capital and build bridges with people to reach consensus.
- Spread: Add exciting images and explanatory graphics to your presentation. Make sure to present the “wow factor” of your story well and to the point.
At the end of her session, the inspiring Lilah Jones concluded with a 30-day challenge and gave viewers the following tasks.
- Find a data project to which you can apply today's concepts.
- Tell your boss, colleagues or friends a data story to practice.
- Find a partner who will support you in this task.
We would like to thank Lilah Jones for her contribution.
Data storytelling: ideas for implementation
Making a story out of your data can be challenging. Crafting a story that captivates your audience is even more challenging. And finding a way to do this with market research data in a way that both satisfies your stakeholders' needs and relays the information they need to hear can be the height of the challenge! Here are some ideas we can learn from storytellers to craft a story that will resonate with your audience.
What do you want to say?
This can be the most difficult part of the entire data storytelling process. When it comes to gaining insight, market researchers don't really face any major challenges. However, when it comes to writing a good story around this insight, it's no longer so simple and a new question arises: What is the one insight or action you want your audience to remember? Here are some examples:
- Question: How satisfied are our customers with our products? Conclusion: Customers really need a specific improvement in the product so that they are more satisfied.
- Question: What are the key things we can do to improve our customer service? Conclusion: Customer service is good, but the product catalog has a clunky interface that needs an overhaul.
- Question: What should we focus on in the fourth quarter to make our workplace even better? Conclusion: Address the fact that employees are concerned about the reports they are hearing that the industry is at risk of major losses, rather than the fact that there is something wrong with their work environment at your company.
You'll see that in each of these examples, the result is not necessarily an answer to the original question, but rather an important insight that your stakeholders want (or need) to hear. This is one of the most important insights for data storytelling.
What is your stakeholders’ agenda?
Each stakeholder has their own agenda that you must consider as you work on the story you are trying to tell. This includes biases, preconceived notions, and expectations of what the data will tell them. Imagine working as a market researcher for an inventor who is looking for a market for a newly invented product. Let's say the research reveals that there is no market for this product. So they provide a whole collection of data in a report that basically says this product has no chance. You can imagine how well your client listens to what you have to say. But if you had instead provided ideas about how the product could be improved to enter a particular market and written a story about how the obstacles could be overcome, you would probably have been listened to more carefully.
Make your story personal
When was the last time you listened intently to a story that was completely devoid of emotion or that you didn't feel connected to in any way? Good data storytelling requires figuring out how to leverage the emotional aspect that comes from the data and how that aspect connects with the target audience. When someone commissions you to write a story based on data, that connection is basically there. But if you do your own research and want to reach a specific target audience with your findings, then you should also master their wording and know their motivation.
Look at good storytellers
TED talks (also TED talks, lectures and discussions on the topics of technology, entertainment, design) are ideal for learning the art of data storytelling: Many of the speakers find a way to convey data in a story format that... Viewers excited, inspired and motivated to act. The videos that go viral are often the videos in which the presenters have found a way to engage the audience, whether by addressing preconceived notions or presenting personal stories. They are examples of how data can be presented as a story that is remembered and moves audiences to action.
Book tip: Effective Data Storytelling. How to Drive Change with Data, Narrative and Visuals
 In his 336-page book, Brent Dykes shows that the ability to communicate effectively with data is no longer a luxury in today's economy, but rather an essential necessity. The author, who is also Chief Data Storyteller at AnalyticsHero, explains how important it is to captivate the target audience with an exciting story and how you can tell a story based on numbers. Effective Data Storytelling also includes practical tips on how to convey insights gained from data through compelling and memorable data stories. Brent Dyke's book is available from bookstores under ISBN 978-1119615712.
1:1 live online presentation:
Collect and analyse qualitative and quantitative data using the market research platform QuestionPro
Good data storytelling requires valid and reliable data. We would be happy to show you in a personal live Zoom demo how you can obtain and analyse high-quality data using QuestionPro's market research platform. We look forward to speaking with you!
Make an individual appointment now.
Try software for market research and experience management now for 10 days free of charge!
Do you have questions about storytelling in marketing or market research? Simply contact us via contact form. We look forward to a dialogue with you! You too can test QuestionPro for 10 days free of charge and without risk in depth!
Test the agile market research and experience management platform for qualitative and quantitative data collection and data analysis from QuestionPro for 10 days free of charge
FURTHER KEYWORDS
SHARE THIS ARTICLE
KEYWORDS OF THIS BLOG POST
Storytelling | Marketing | Market research
FURTHER INFORMATION
- Market research: examples, tips, data collection, data analysis, software for carrying out and presenting the results
- The big QuestionPro-Guide on the subject of customer surveys: definition, development, methods, examples, evaluation, template for import.
- Customer Experience Management: Tips, Tools, Best Practices
- Reputation management: tips, software, app
- Sentiment analyses and semantic text analysis based on artificial intelligence
- All information about the experience management platform QuestionPro
- Conducting employee surveys: A specialist article from QuestionPro


