Market research
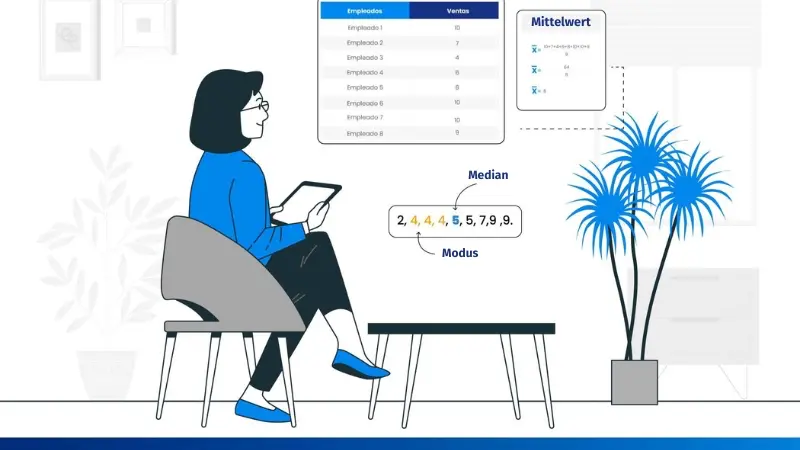
The Mean, median and mode are basic statistical tools that are easy to calculate but are sometimes confused.
These measures of central tendency are used to describe and understand the distribution and characteristics of a data set.
Today we will learn how to calculate each of these three values.
CONTENT
- 1 What are the mean, median and mode?
- 2 What is the mean?
- 3 What is the median?
- 4 What is the mode?
- 5 When are mean, median and mode used?
- 6 Conclusion
- 7 1:1 Live Online Presentation: QUESTIONPRO MARKET RESEARCH SOFTWARE
- 8 Try software for market research and experience management now for 10 days free of charge!
What are the mean, median and mode?
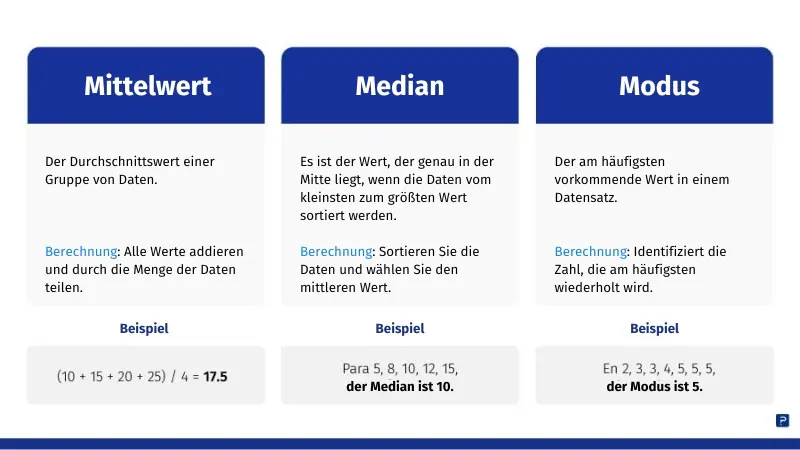
The mean is the arithmetic mean of a series of numerical values. The median is the middle value of a data set when the values are sorted in ascending or descending order. The mode is the most common value or category within a data set.
The mean, median and mode are the three most commonly used measures of central tendency for populations that do not contain too much data, that is, that do not need to be grouped together.
When we talk about measures of central tendency, we are referring to statistical measures that aim to summarize a series of values into a single value.
Mean, median and mode are expressed in the same unit as the original data. These measures provide insight into the core or typical value of a data set and help us analyse and compare different data points.
What is the mean?
The mean, also known as the average, is the value obtained by dividing the sum of a series of numbers by the number of numbers.
The mean represents the equilibrium point of the distribution and is influenced by the extreme values. It provides a measure of the general trend or mean of the data.
It is calculated by summing all values in the data set and dividing the sum by the total number of data points.
Some features of the mean are:
- All values are taken into account.
- The numerator of the formula is the number of values.
- If there are extreme values, the sample is not accurately represented.
How do you get the mean?
To find the average of a quantity, simply follow these steps:
- Determine the set of values you want to average over.
- Add the values together to get the total.
- Count the number of values in the set.
- Divide the sum of the quantity by the number of numbers.
Example of averaging
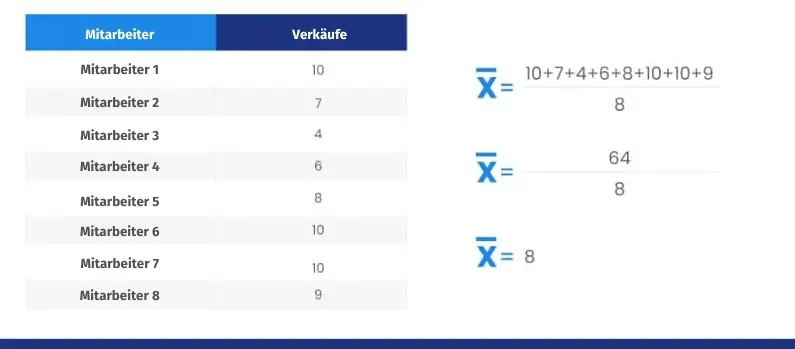
In a wholesale store, you want to calculate the average number of sales that employees made during the month. To calculate the average, do the following:
What is the median?
The median is a value that lies in the middle of the other values, meaning that if you sort the numbers from smallest to largest, it will lie exactly in the middle between the values above it.
It is calculated by adding all the values in the data set and dividing the sum by the total number of data points.
The mean represents the break-even point of the distribution and is influenced by the extreme values. It provides a measure of the general trend or average of the data.
Some features of the mean are:
- The operations to calculate the value are very easy to perform.
- The measure does not depend on the values of the variables, but only on their order.
- Generally the values are integers.
- The median can be calculated even if the numbers above and below are not limited.
How do you calculate the median?
The steps to find the median are:
- Order all numbers from smallest to largest value.
- Find the number in the middle of the set.
- For an odd number: Cross out the last number on the left, then the first number on the right, and repeat until only one number remains, representing the median.
- An even number leaves two numbers in the middle. Add them together and divide by 2 to get the median.
Median example
- The number of values is odd
If we have the values 9,5,4,2,7, we order: 2, 4, 5, 7, 9. The middle element is 5 because it is two values above and two values below.
- The number of values is even
If we have the values 9,5,4,2, we order: 2,4,5,9. In this case the two central values 5 and 4 are taken, the median is the average of both: 9.
What is the mode?
The mode is the value that occurs most frequently in a data set. Unlike mean and median, the mode does not require numerical values and can be used with categorical or discrete data.
A data set can have one mode, called unimodal, or multiple modes, called bimodal or multimodal. A data set is said to be amodal if the values in a cluster do not repeat.
The main features of the mode are:
- It is a very clear sample
- The operations to determine the result are very easy to work out.
- The values presented can be qualitative and quantitative.
How to determine the mode
The steps to determine the mode of a set are as follows:
- Write down all the numbers of the set.
- Find the number or numbers (in bimodal or multimodal cases) that occur most frequently.
Mode example
When are mean, median and mode used?
The mean is typically the most commonly used measure of central tendency because it is highly useful in many contexts.
However, if there are cases in a population where the data is much higher or lower than the rest of the group, it is recommended to use the median or mode because the mean is more influenced by extreme values.
Also find out what the Variance and standard deviation at a hunt.
Conclusion
As you can see, mean, median and mode are very easy to use and can help obtain relevant values in market research, medical research, etc.
Each of these measures of central tendency provides valuable information about a data set.
While the mean gives an average value, the median gives an average and the mode identifies the most common value. Understanding these measures allows us to better understand the characteristics and distribution of the data, making analysis and decision-making easier.
1:1 live online presentation:
QUESTIONPRO MARKET RESEARCH SOFTWARE
Arrange an individual appointment and discover our market research software.
Try software for market research and experience management now for 10 days free of charge!
Do you have any questions about the content of this blog? Simply contact us via contact form. We look forward to a dialogue with you! You too can test QuestionPro for 10 days free of charge and without risk in depth!
Test the agile market research and experience management platform for qualitative and quantitative data collection and data analysis from QuestionPro for 10 days free of charge
FURTHER KEYWORDS
SHARE THIS ARTICLE
KEYWORDS OF THIS BLOG POST
Mean, median and mode | Average | Medianmodus
FURTHER INFORMATION
- Research Synthesis: Understand your research results
- Synthetic data: what they are, types, methods and uses
- Research Process: Steps to conduct the research
- Synthetic data generation: techniques and perspective
- Digital behavioral data: what it is, its importance and risks
- Data filtering: what it is, benefits and examples
- Data Science and Artificial Intelligence: Which is Better?
- Big Data and Artificial Intelligence: How do they work together?


