Intelligent Data Analysis
XA analysis dashboard:
Response views, extended heatmaps, trendline toggle, text comment widget, filter rights: These are the innovations in QuestionPro's XA dashboard
What is QuestionPro’s XA Dashboard?
The XA Dashboard from QuestionPro is a powerful, widget-based and high-performance real-time analysis tool for evaluating and visualizing data from surveys and touchpoint analyses. In addition to the core functions of graphical data analysis in real time, special features of the XA Dashboard include the sophisticated rights and roles concept within user management, the multi-dashboard capability, AI-based sentiment analysis and the intuitive user interface. The XA Dashboard is a central component of the QuestionPro Experience Management platform.
What's new in the XA Dashboard?
QuestionPro's XA dashboard is constantly being developed closely to meet the needs of our customers. And these are the innovations.
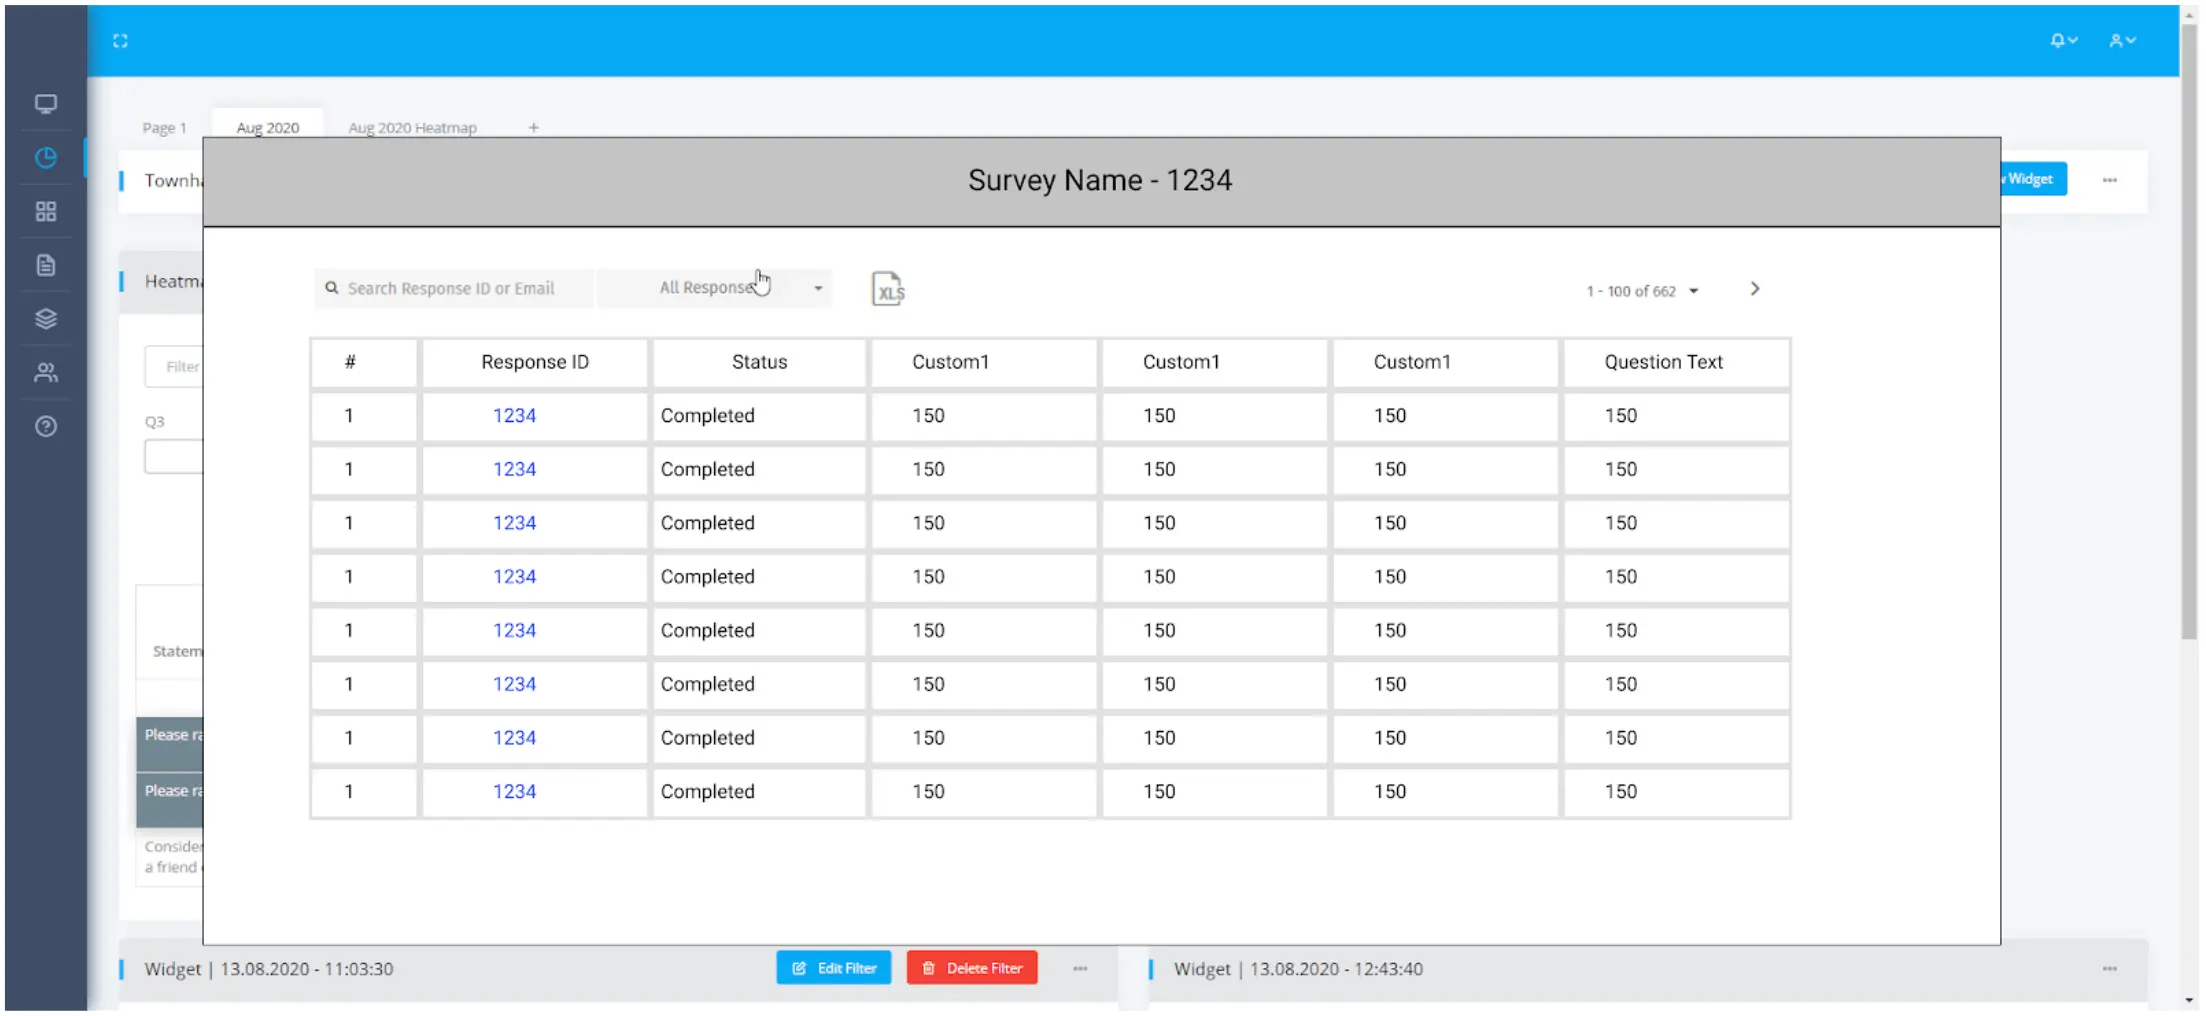
XA Response Viewer
Until now, users of the In addition, it has not yet been possible to filter the feedback according to certain criteria.
→ Here you will find an overview of the new features of the XA Response Viewer
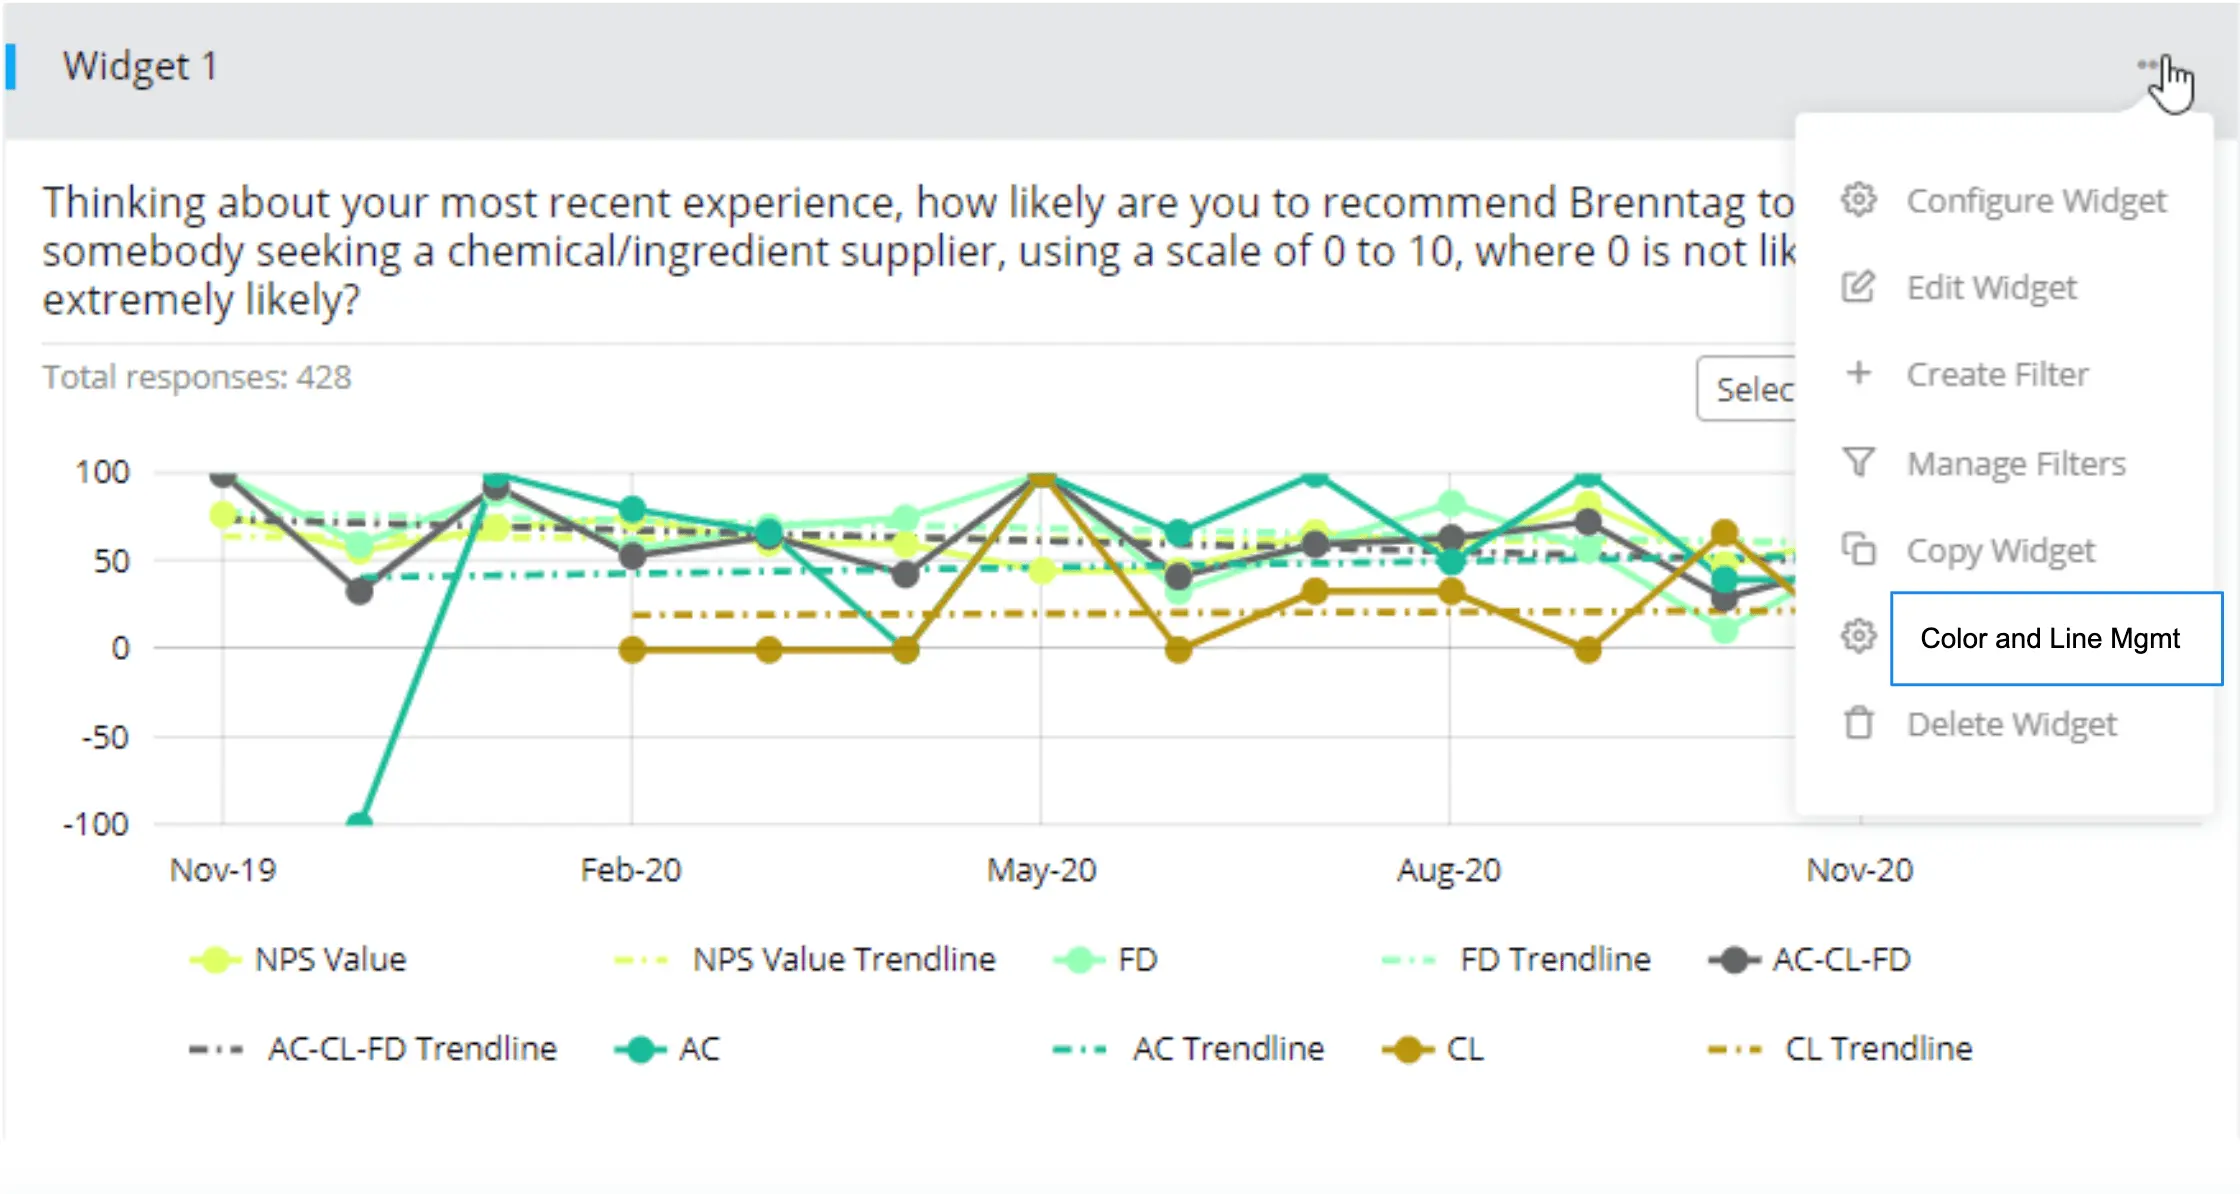
Trendline Toggle
If users wanted to add a trend line to their line chart, this was previously possible without any problems, but was rather confusing when there were multiple trend lines within a chart. The solution: From now on, trend lines can be filtered according to certain criteria. QuestionPro has also integrated color and line management, which helps you display lines in different colors and hatching.
→ Here you will find an overview of the new features of the Trendline Toggle
Heatmap extensions
Heatmaps are very popular. A heatmap is a data visualization technique that represents the size of an item as a color, giving viewers obvious visual clues about an item's characteristic. QuestionPro has further developed the heatmap feature within the XA Dashboard to offer you the greatest possible usability, such as the ability to create filter hierarchies when using matrix questions. Check out the following screencast.
→ Here you will find an overview of the heatmap innovations
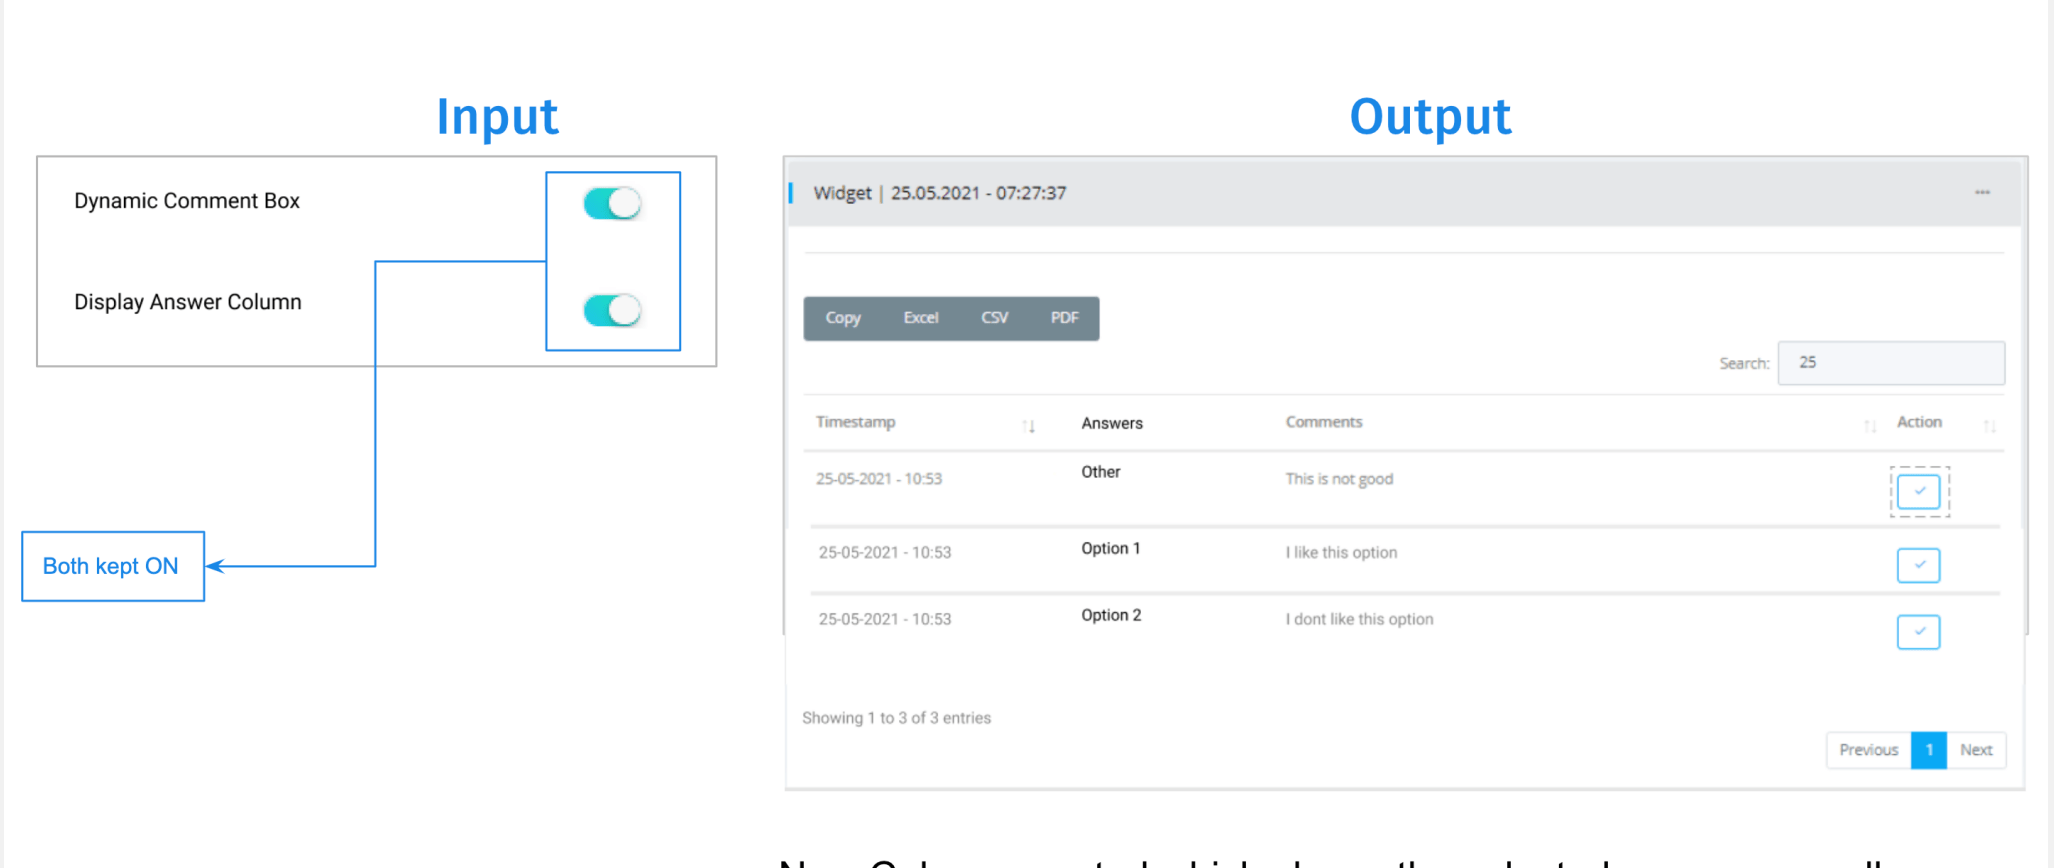
Text Comment Widget
Of course, with the XA Dashboard it is possible to analyse text comments, even based on artificial intelligence. We have now expanded the XA Dashboard to include the ability to analyse text comments that are generated from QuestionPro question types that contain a hidden dynamic comment box. This means that a comment box only appears for survey participants if they complete a specific interaction within the questionnaire, such as a negative rating in a Net Promoter Score question. You can find more information about the dynamic comment box in our help center: Dynamic comment box.
→ Here you will find an overview of the new features of the Text Comment Widget
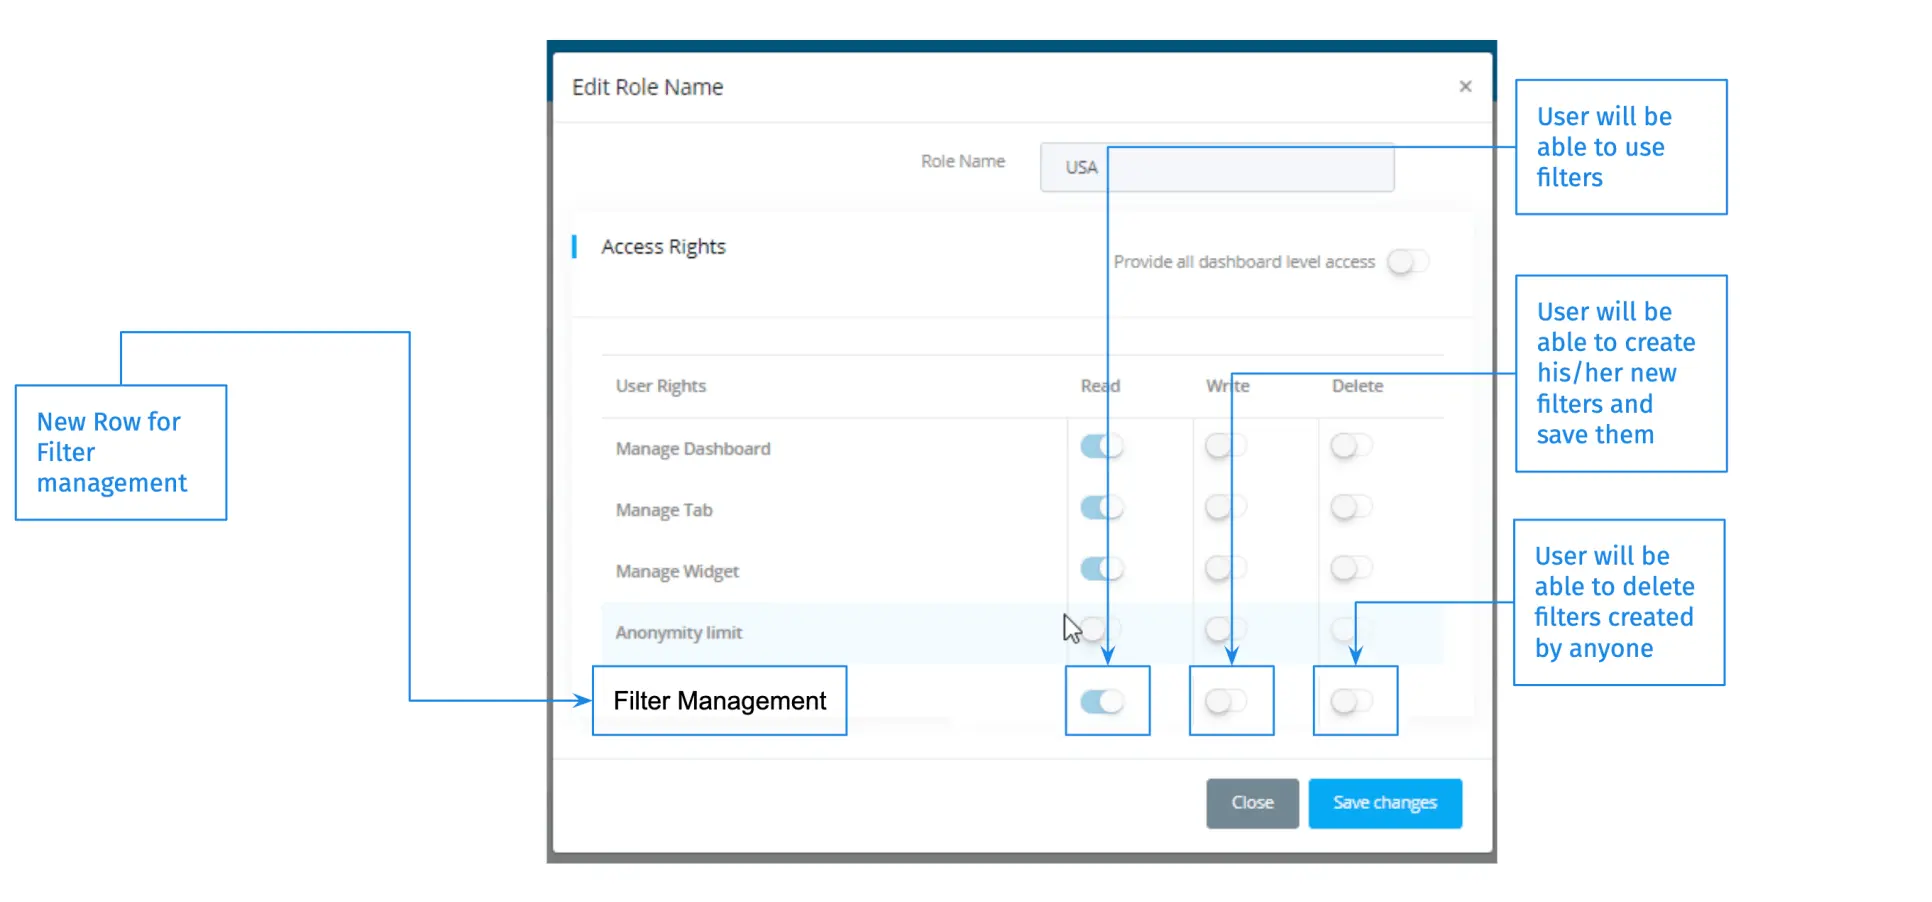
Filter permissions
When analytics dashboards are shared with users, administrators have the ability to grant certain rights to the dashboard, such as: E.g. read, write, delete, etc. These rights relate to several attributes. Dashboard settings, widget settings, etc. QuestionPro has now expanded this rights model and allows administrators to assign rights for filtering data.
→ Here you will find an overview of the innovations to filter rights
1:1 live online presentation:
XA Dashboard: Data analysis as part of experience management
Would you like to see the innovations in the QuestionPro XA Dashboard in a live demo? Make an individual appointment now.
Try software for market research and experience management now for 10 days free of charge!
Do you have any questions about the content of this blog? Simply contact us via contact form. We look forward to a dialogue with you! You too can test QuestionPro for 10 days free of charge and without risk in depth!
Test the agile market research and experience management platform for qualitative and quantitative data collection and data analysis from QuestionPro for 10 days free of charge
FURTHER KEYWORDS
SHARE THIS ARTICLE
KEYWORDS OF THIS BLOG POST
Analysis | Dashboard | Experience Management | Intelligent Data Analysis | Data Visualization
FURTHER INFORMATION
- The big QuestionPro-Guide on the subject of customer surveys: definition, development, methods, examples, evaluation, template for import.
- Customer Experience Management: Tips, Tools, Best Practices
- Sentiment analyses and semantic text analysis based on artificial intelligence
- All information about the experience management platform QuestionPro


