Analysis & reporting
Perform correlation analysis
- 1 What is Correlation Analysis?
- 2 Examples of correlations
- 3 Carry out correlation analysis without prior knowledge of QuestionPro
- 4 1:1 Live online presentation: Carry out correlation analysis quickly, easily and without prior knowledge with QuestionPro
- 5 Try software for market research and experience management now for 10 days free of charge!
What is Correlation Analysis?
Correlation analysis: definition
Correlation analysis is a bivariate statistical method for measuring the strength of the linear relationship between two variables and calculating their relationship. Simply put, correlation analysis calculates the amount of change in one variable caused by the change in the other. A high correlation indicates a strong relationship between the variables, while a low correlation means that the variables are weakly related to each other. Correlation analysis can be used to identify relationships, patterns, significant connections and trends between two variables or data sets.
Correlation coefficient
The correlation coefficient is the numerical value that indicates the type of correlation, that is, the statistical relationship between two variables. The value of the correlation coefficient (rs) varies between + 1 and - 1 in terms of the strength of the relationship between the variables. The closer the value of the correlation coefficient goes to 0, the weaker the relationship between the two variables. The direction of the relationship is indicated by the sign of the correlation coefficient; a + sign indicates a direct relationship and a – sign indicates an inverse relationship.
FREE E-BOOK:
Conduct market research as self-service
Examples of correlations
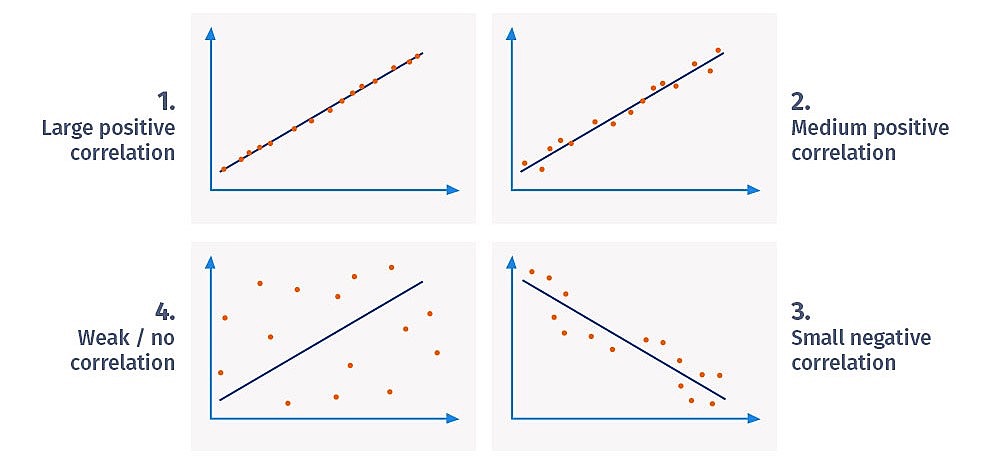
The correlation between two variables can be either positive correlation, negative correlation, or no correlation. Let's look at examples of each of these three types:
- Positive correlation: A positive correlation between two variables means that both variables are moving in the same direction. An increase in one variable leads to an increase in the other variable and vice versa. For example, if you spend more time on a treadmill, you burn more calories.
- Negative correlation: A negative correlation between two variables means that the variables move in opposite directions. An increase in one variable leads to a decrease in the other variable and vice versa. For example, increasing the speed of a vehicle reduces the time it takes to reach your destination.
- Weak/zero correlation: No correlation exists when one variable has no influence on the other. For example, there is no correlation between the number of years of school a person has attended and the number of letters in their first name.

Carry out correlation analysis without prior knowledge of QuestionPro
With the help of correlation analysis, the dependence of two variables on each other can be determined relatively easily. With the QuestionPro analysis tools you can carry out correlation analyses without knowing the formula or evaluating data manually, for example in Excel.
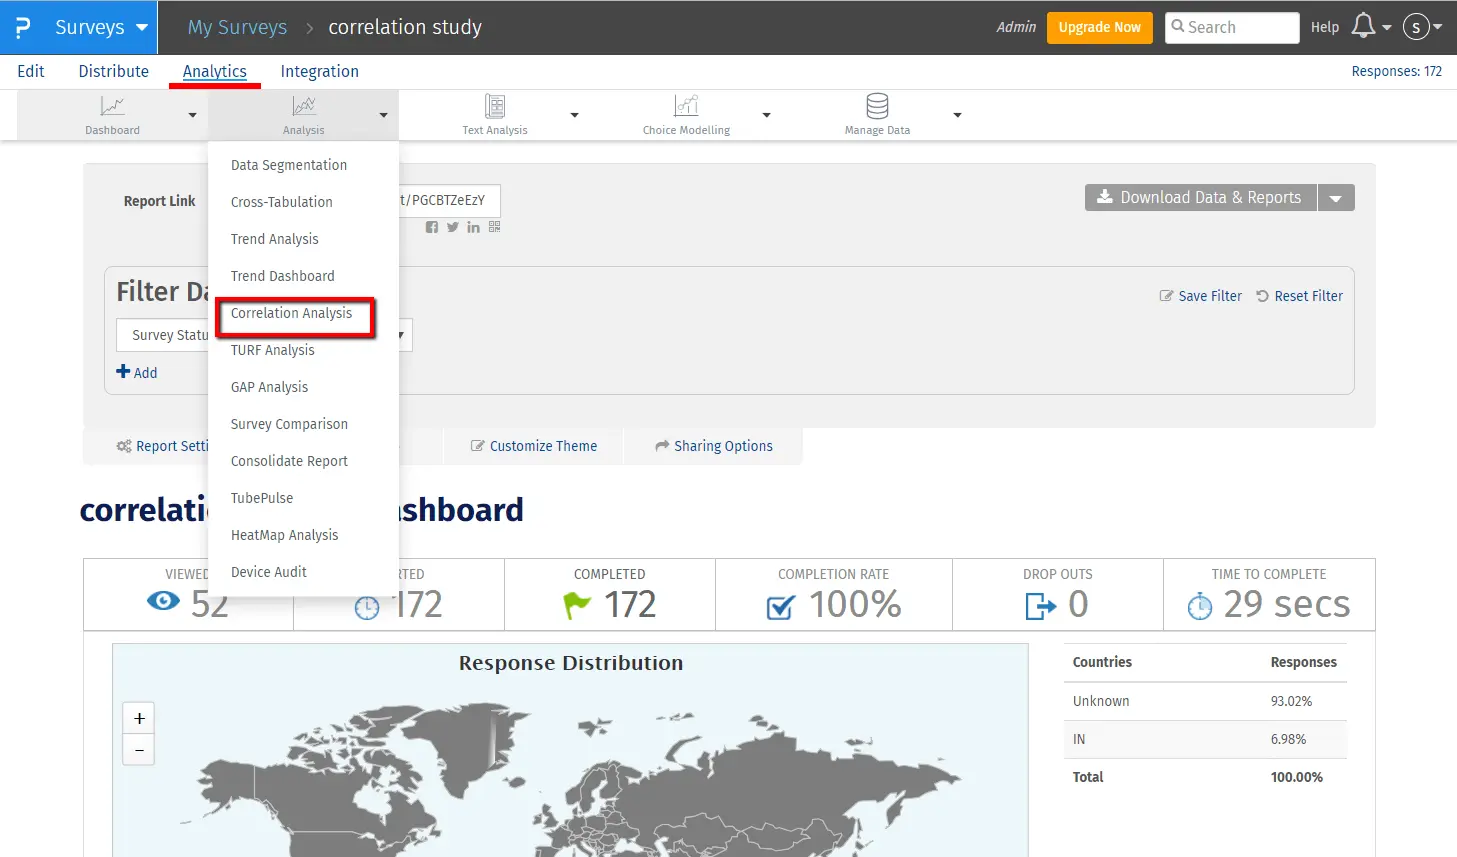
Step 1: You have carried out a survey, customer survey or employee survey and now want to know whether two variables are related to each other. You call up the survey for which you want to carry out a correlation analysis and navigate to the ANALYTICS menu item and then select CORRELATION ANALYSIS under the ANALYSIS menu item.
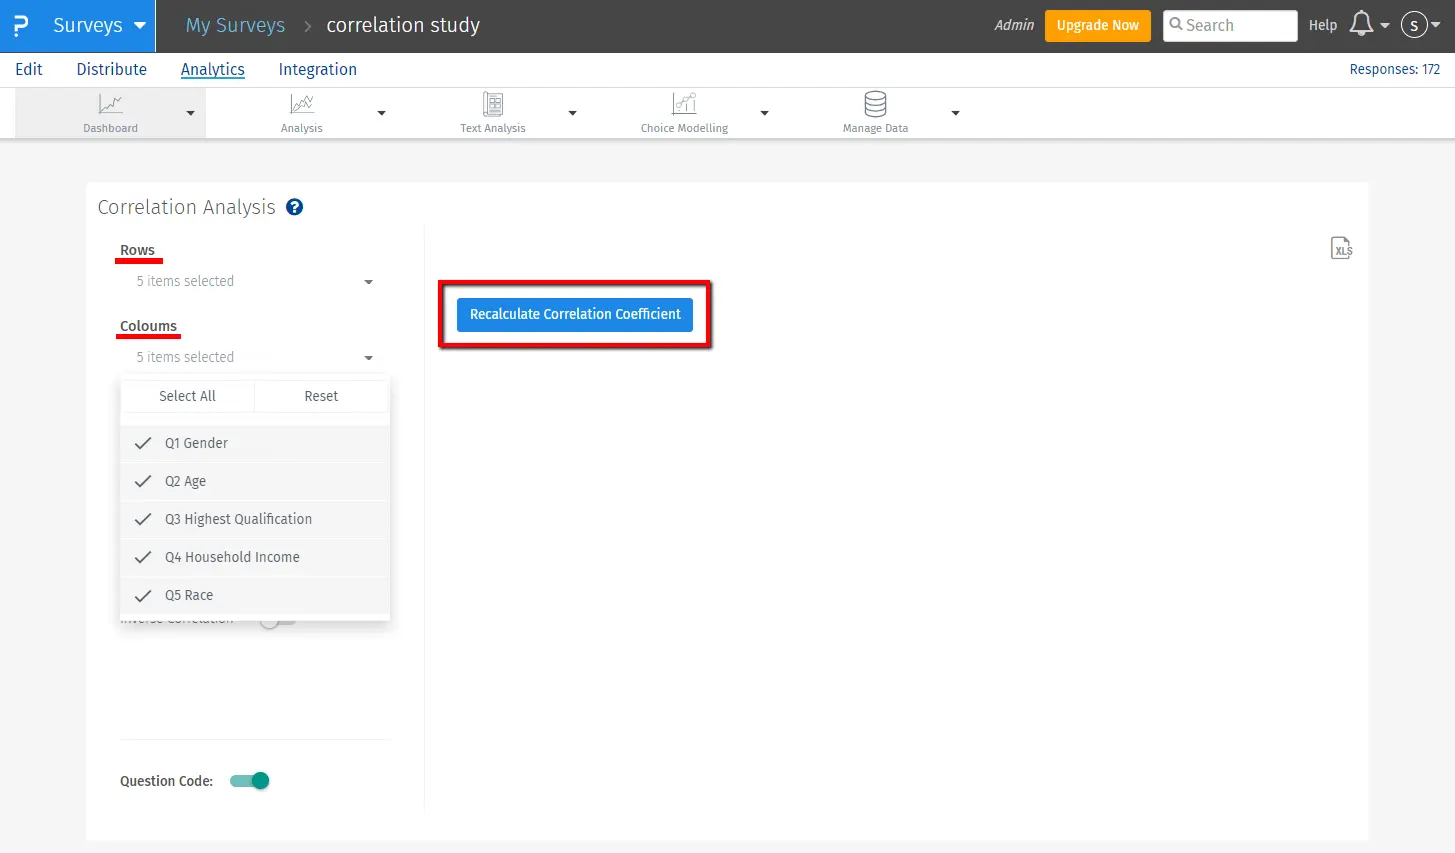
Step 2: In the left pane, select the questions you want to check for any correlation and click RECALCULATE CORRELATION COEFFICIENT.
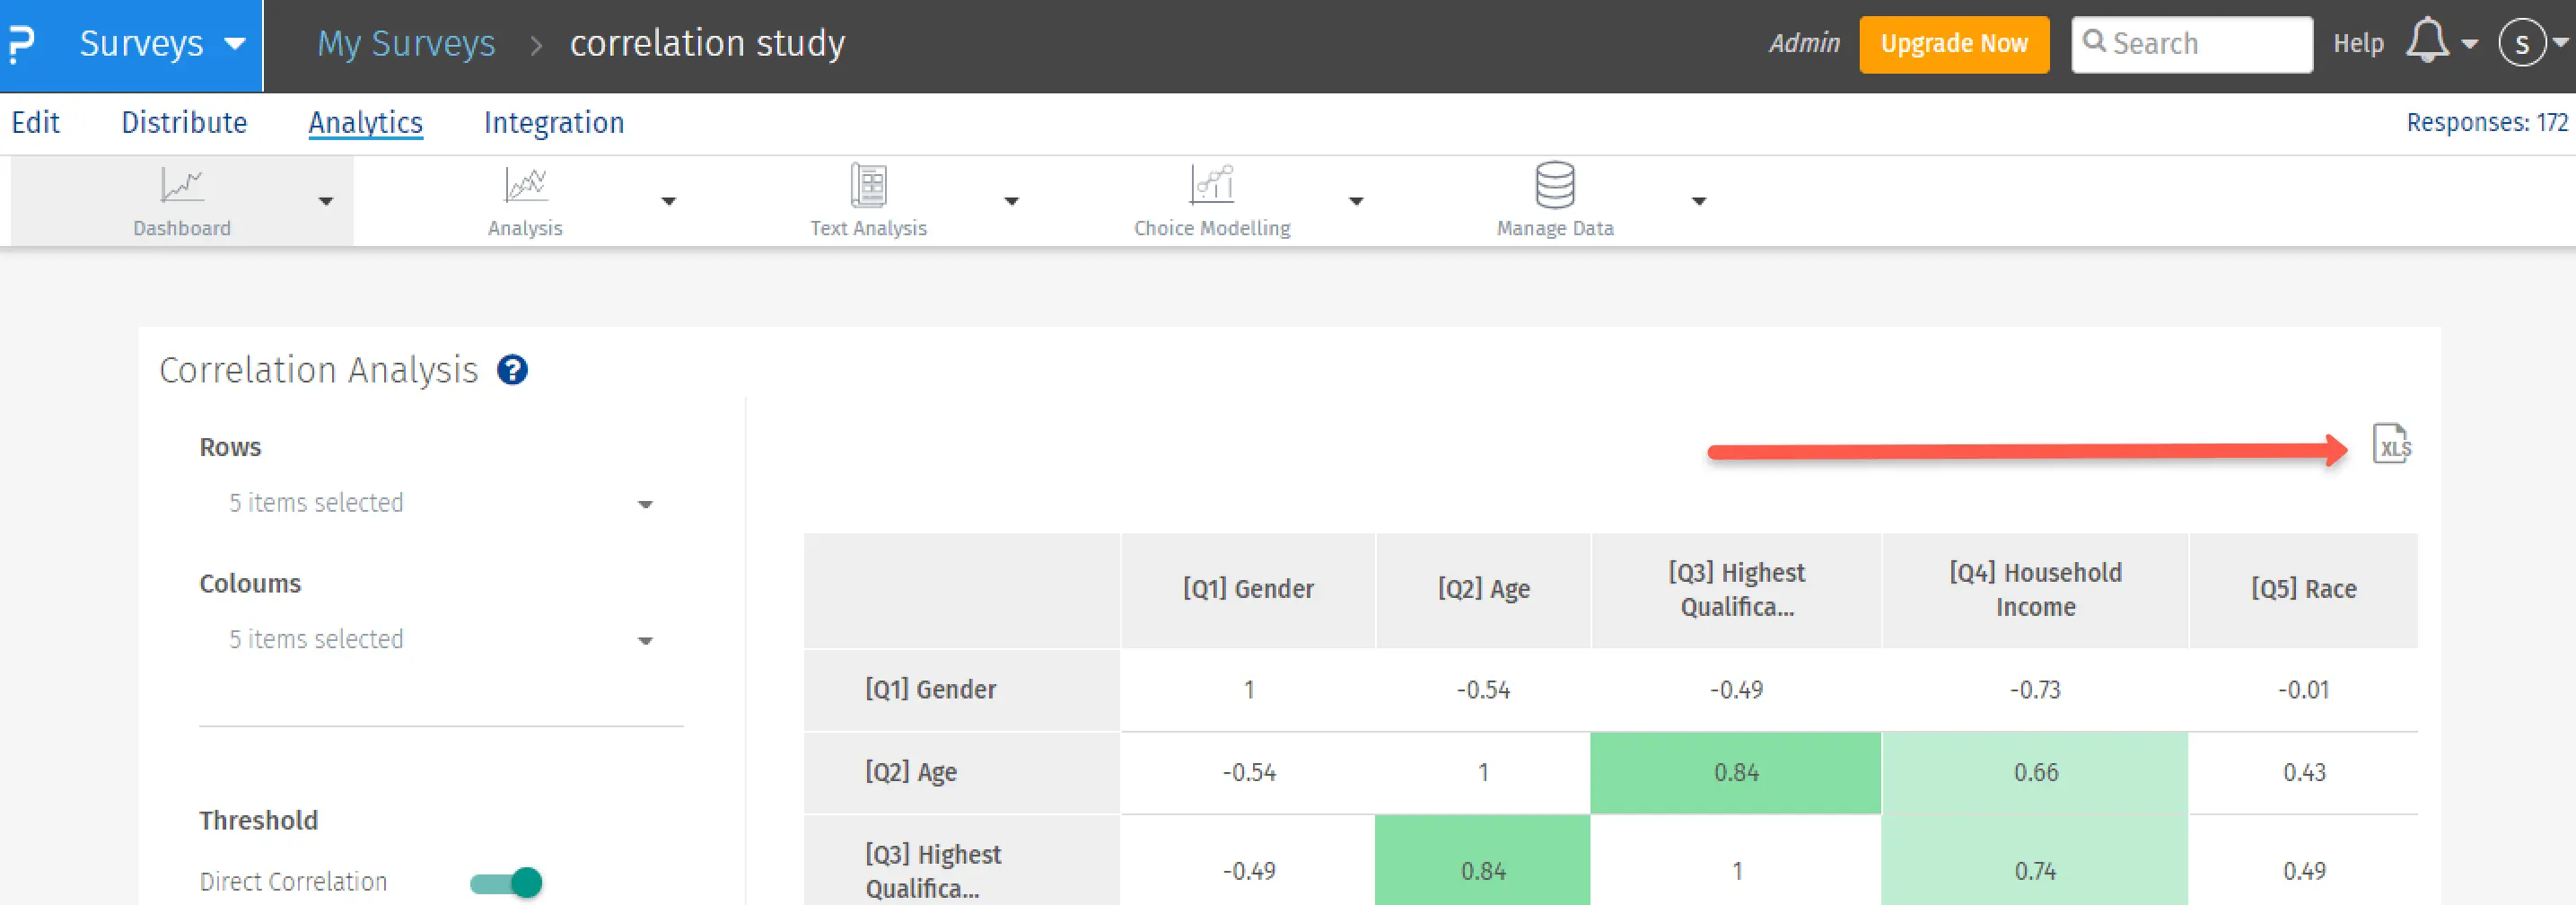
Step 3: Interpretation of the results. The Threshold section helps you color-code those cells that indicate the strength of the relationship between the variables. For a direct correlation, the threshold is preset to 0,65 and has 3 colors. If the value of the correlation coefficient is less than 0,80 to 0,65, the cell is colored light green, indicating low strength of the relationship. If the value is between 0,80 and 0,90, the cell will be colored medium green, and if the value is above 0,90, the cell will be colored dark green, indicating a high correlation of the variables you previously selected.
An Excel download with all color coding is supported for correlation analysis. To do this, simply click on the XLS symbol.
And that was about it. Your correlation analysis is ready.
1:1 live online presentation:
Carry out correlation analysis quickly, easily and without prior knowledge with QuestionPro
We would be happy to show you in a 1:1 Zoom online demo how you can easily carry out correlation analyses with the market research and CX platform QuestionPro without in-depth statistical knowledge or prior knowledge. We would also be happy to show you other analysis options and how you can quickly and easily create reports in different output formats.
Make an individual appointment now.
Try software for market research and experience management now for 10 days free of charge!
Do you have any questions about the content of this blog? Simply contact us via contact form. We look forward to a dialogue with you! You too can test QuestionPro for 10 days free of charge and without risk in depth!
Test QuestionPro's market research and experience management platform for free and carry out correlation analyses in the future without spending a lot of time.
FURTHER KEYWORDS
SHARE THIS ARTICLE
KEYWORDS OF THIS BLOG POST
Correlation analysis | draw up | perform | correlation | Correlation coefficient


