Intelligent Data Analysis
With the Survey-Dashboard of QuestionPro, Evaluate survey data quickly, easily and in real time with the integrated analysis tools. Free test now!
Survey data analytics dashboard
Create custom survey dashboards for better visibility of your survey results
Companies conduct surveys to collect data and make decisions based on data analysis. It is important to see the progress of the analysis in real time to identify trends, make quick decisions and understand the performance of a survey.
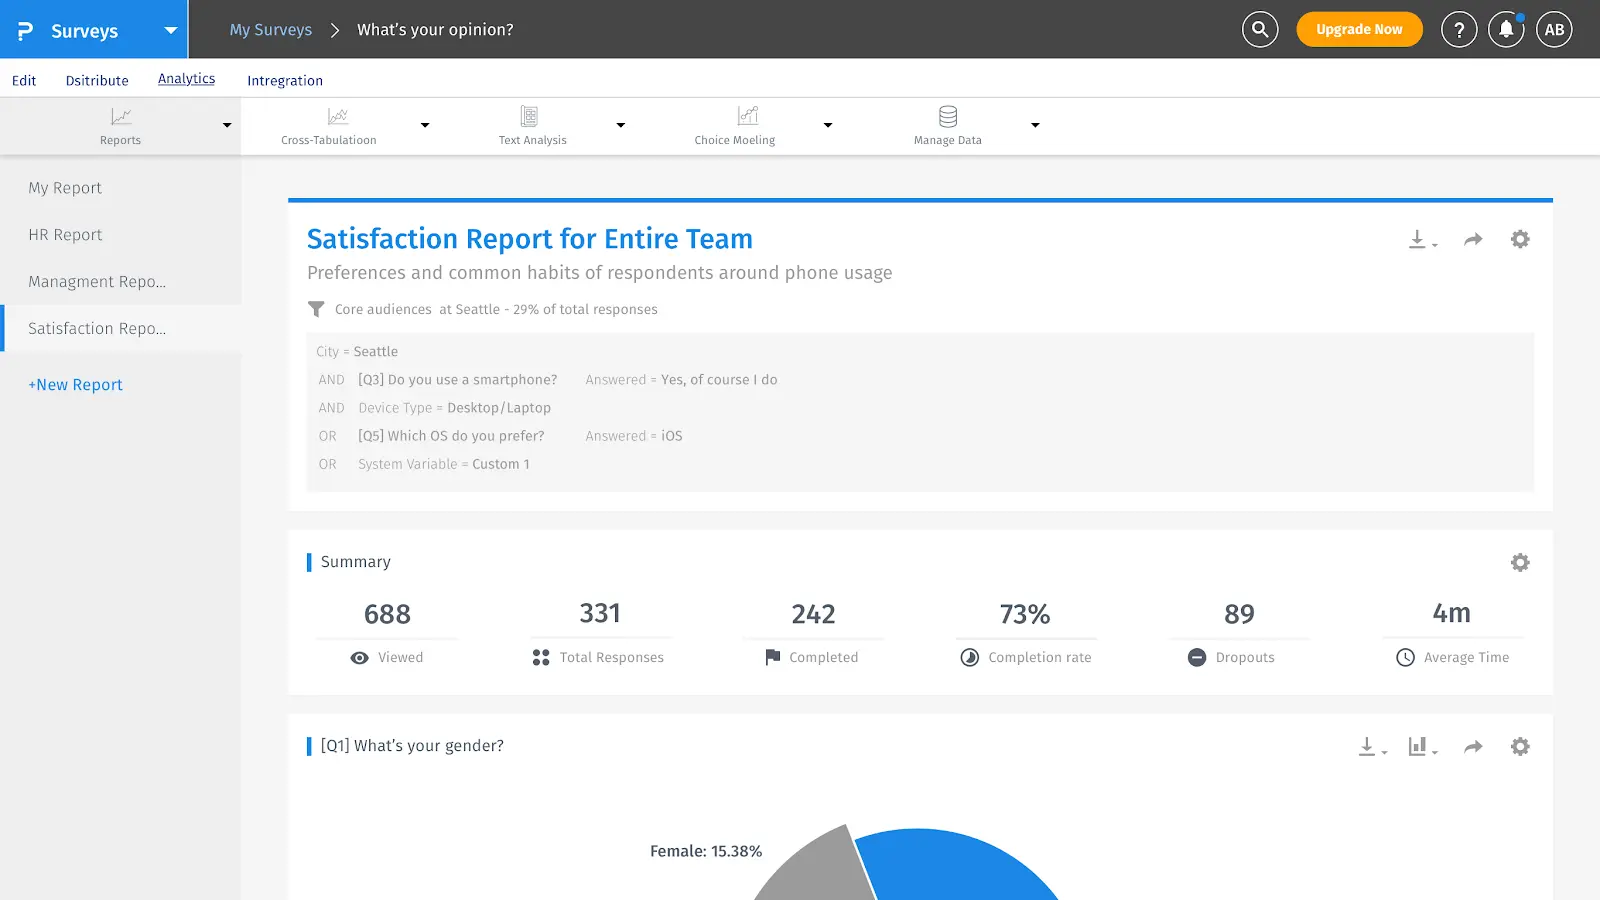
QuestionPro's survey dashboard allows you to visualize data in different chart types in real time to get different perspectives on the same results. You can share the reports with others or export them in standard formats such as .doc, .ppt and .pdf. The survey dashboard gives you a quick overview of the response rate, completion rate, abandonment rate, response distribution for each question, and more.
Survey dashboards create a better overview of your survey results
Survey dashboards allow you to clearly analyse and process your survey data. You can drill down into details about each question and compare it to the answers to other questions. Or set filters, e.g. B. based on demographic parameters and see the feedback from a specific group of survey participants.
You can share the survey results and make decisions together based on the data. Multi-survey dashboards also allow you to create selective approvals for selected questions. Easily hide unnecessary details from your survey reports with a few clicks of the mouse.
Innovations in the QuestionPro analysis dashboard
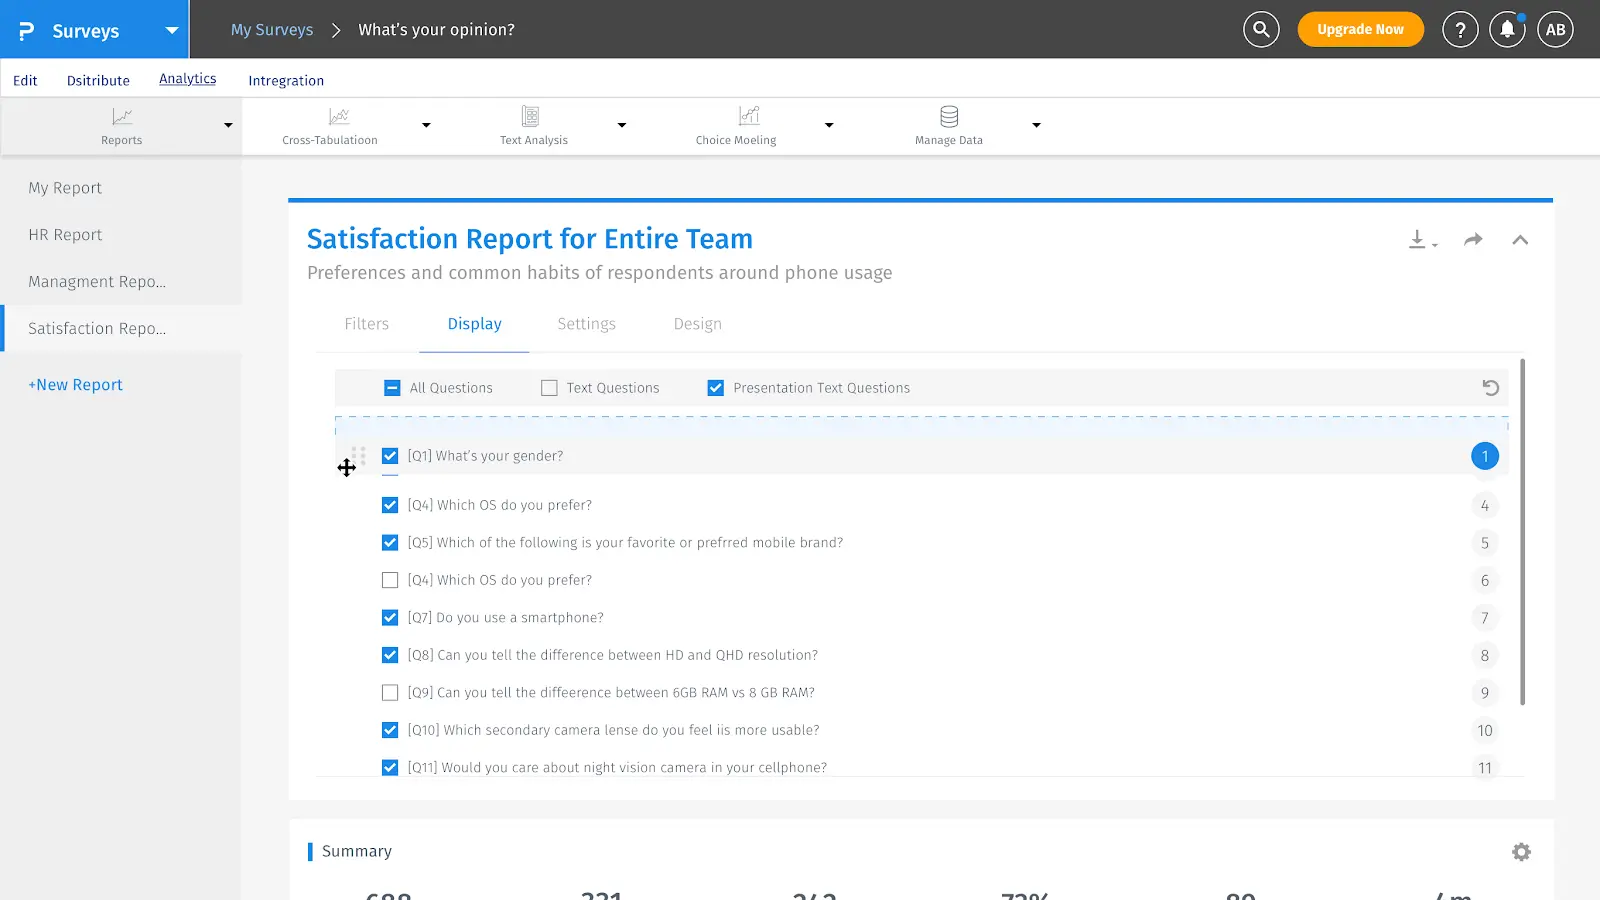
QuestionPro users can create multiple dashboard views. Changes made are applied immediately. You can customize the user interface as well as the functionality and content of the reports. For example, create custom dashboards by rearranging, hiding, or combining questions in the report.
For example, you can duplicate the default report and then customize the new report based on the audience that will receive that report. You can also fully customize the content to be displayed on the survey dashboard, add a logo, completely change the appearance, and share the survey dashboard and reports with different user groups.
Take advantage of the new custom survey dashboard in QuestionPro
The UI updates provide better usability and make reporting easier. Users have more flexibility to see multiple views of the same survey results. This means that the original report remains intact and is not overwritten or changed.
Below are some of the ways users can use custom dashboards to improve their research and data analysis.
Multiple perspectives on the same data
Let’s take an employee survey as an example. An analyst may want to create multiple reports of the same data set, e.g. For example, an HR report, a management report, an employee satisfaction report, etc. For a single view of the report, users may have had to change the filter and settings for the same view. With multiple presentations, this was very time-consuming and tedious. With multiple views of the standard report, users can now create and save multiple reports using the same survey data.
No delay in reporting survey reports with very large data sets
A very large data set can significantly delay reporting. Changing a few details can mean re-creating many reports. Changing settings and repeatedly generating multiple reports from a survey with a large number of responses can be a lot of effort. But not with the QuestionPro survey software! The ability to save different representations with QuestionPro's survey dashboard saves a lot of time and nerves!
Custom customization
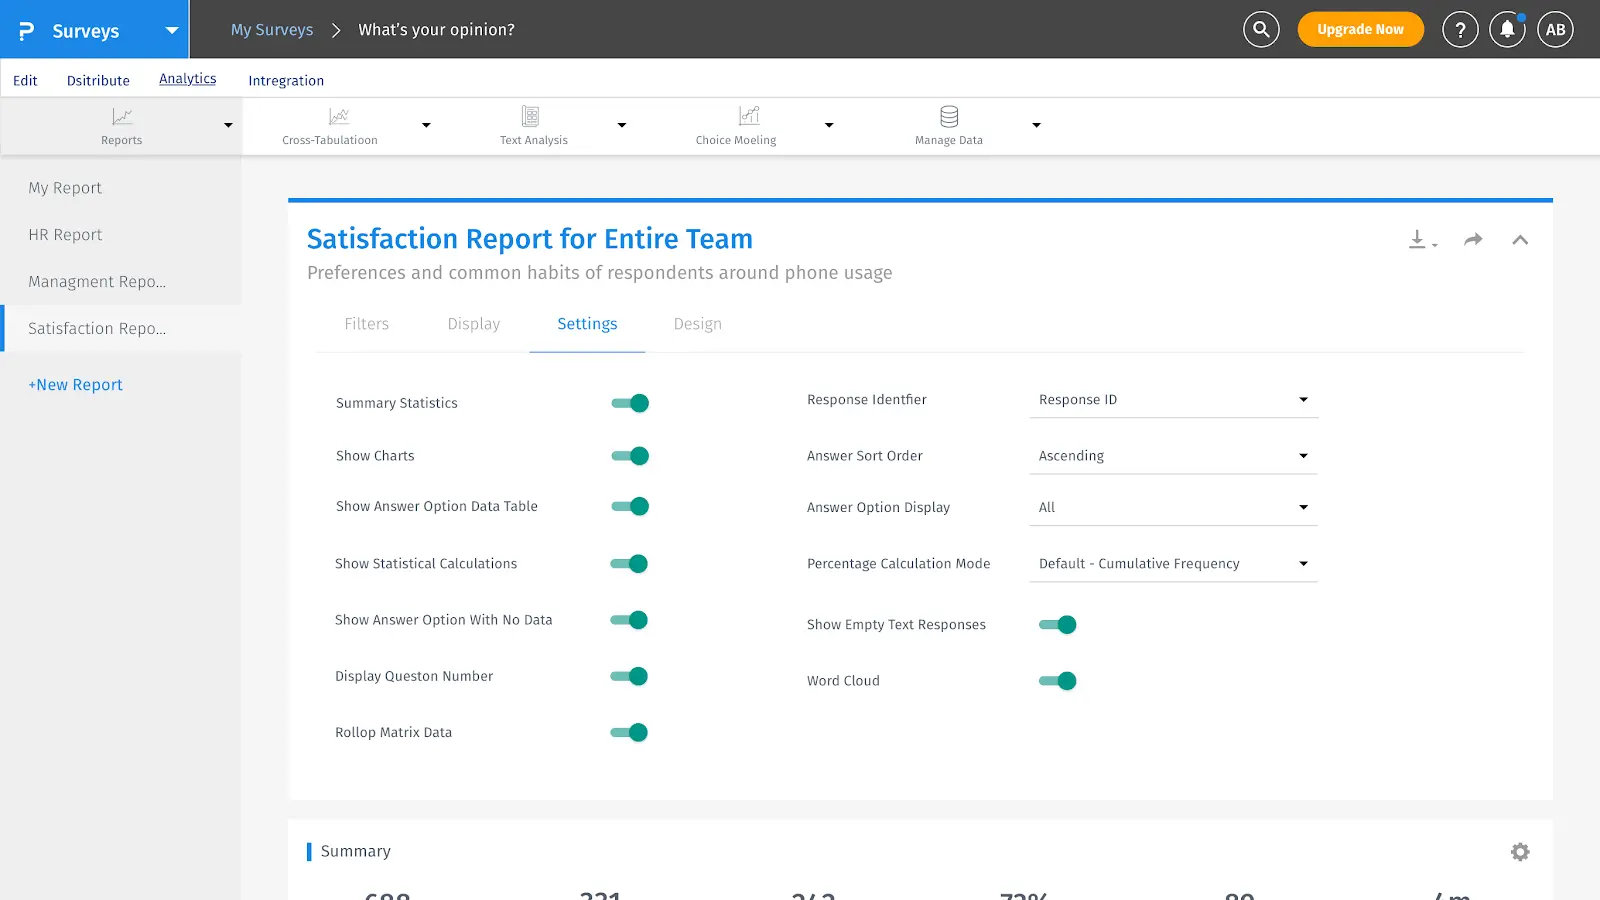
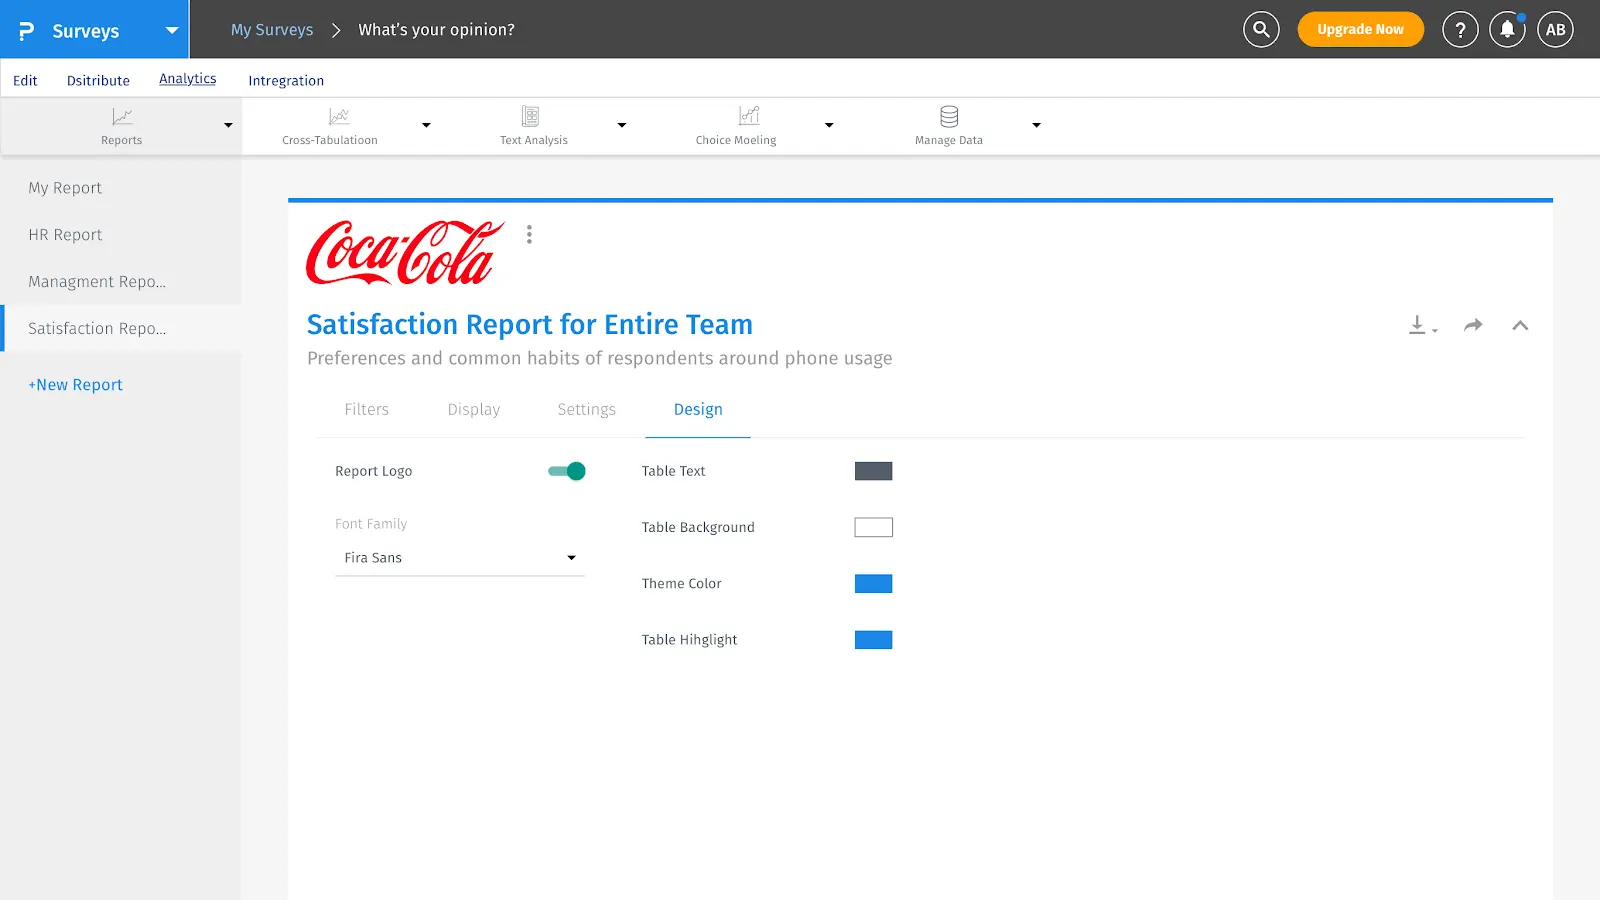
Change the look and feel of your reports to suit your personal needs. UI customization is easier and more efficient than before. In addition, you can create reports with different designs and make changes to your reports even during data collection. You can also change fonts, insert images and logos to customize reports according to your CI.
Try the new reporting features now!
Once you've logged in to QuestionPro and created a survey, click the Analytics tab to view and customize the real-time dashboard of survey results. For step-by-step instructions on creating custom ads with different settings and UI, visit our Help Center. → Customize report
1:1 live online demo:
The new survey dashboard from QuestionPro
Would you like to find out more about the QuestionPro survey dashboard? We would be happy to show you all the features of the survey dashboard in a personal 1:1 live online demo! Arrange an individual appointment now.
Create surveys for free with the professional and web-based survey software QuestionPro
You have any questions or suggestions? We look forward to your inquiry! Simply use the contact formto get in touch. Register now for free and create your first online survey with QuestionPro.
WE WILL GIVE YOU 300 FEEDBACK PER SURVEY. CREATE AS MANY POLLS AS YOU WANT!
FURTHER KEYWORDS
SHARE THIS ARTICLE
KEYWORDS OF THIS BLOG POST
Survey | data | Analysis | Dashboard | Evaluation

